
Median Home Prices get pulled on a monthly YOY basis by some interesting influences. About a week ago I did a post on King County non-distressed property being up 6% YOY.
In these stats, I am NOT excluding short sales and bank owned property from the mix.
Stands to reason if the better properties are selling quickly with multiple offers, that prices are NOT falling in the places where Supply and Demand factors are tipping toward more Demand than Supply. And if overall we are seeing 6% UP for non-distressed property, then some places must be UP OVER 6% for the net result to be 6%.
To find who went up more than the 6% average, I used Redmond 98052. It generally has a higher appreciation level than most of King County AND has little influence of short sales and bank owned property AND it has negligible influence of super inflated land values created by water view considerations. In other words, Redmond 98052 is “close in”, good “commute to” but no major snob factor or “value is in the land” considerations. In fact the lowest priced home sold in May of 2011 in Redmond 98052 was a great little house, and not a tear down at all.
The Median Home Price influence in Redmond 98052 is you need to separate NEW(er) homes from older homes, as the mix skews the median, as noted in the chart below.
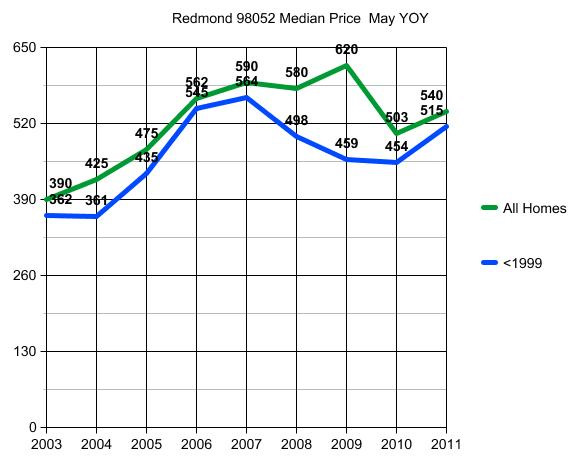
The variance in the overall GREEN LINE median has more to do with the mix of new(er) construction vs homes built in 1999 or before. If you remove the undue influence of NEW HOME mix, you can see the true area appreciation and depreciation levels. Again, short sale and bank owned homes do not influence the median prices in Redmond. Even though they doubled from May 2010 to May 2011, they only went up from 3 of them to 6 of them.
Of MORE relevance is the New House/Old House mix than even overall volume changes.
Also, it’s my recollection that the big jump in 2005 may have had more to do with Microsoft hiring a lot of people all at once, vs the influence of the Credit Bubble.
That supports the flat pricing from May 2003 to May 2004 and the huge upswing in 2005. The upswing in the Green vs Blue line is about New Construction, mostly up on Education Hill, which continued to pull the blue line away from the green line for years thereafter, until 2010 when more people bought older homes than new ones. But NOT in 2005, as the older homes appreciated to the same degree as the new home premium. Same in 2006. Both older and new homes showed a price increase of 20% in 2005 and 25% in 2006. So the upswing was fairly uniform in those two years due to local hirings more than loose lending issues.
The swing in the peak on the Green Line in 2009 was because new(er) homes represented a full 63% of all homes sold that month. Likewise the dip in the Green Line in 2010 was the contrast of only 32% being new(er) homes in the sale mix. In 2011, new(er) homes were 28% of all sales, even less than 2010. So of no influence on the upswing reported.
Since homes built before 1999 did not change YOY as to type and size over the period from 2003 to 2011, the change in price is less influenced by things other than Supply and Demand.
I think the 12% increase is a bit insane and likely not sustainable, and may be a FLUKE of May 2011. BUT it does support my previous post that 6% UP for King County matches the story that decent homes in good places are hard to come by AND on the upswing price-wise.
Common sense tells us that the media reports that Supply is higher than Demand, creating bidding wars, BUT “prices are down”, makes no sense whatsoever. Much more credible that where these multiple offer situations are actually happening, prices are indeed up, and to a large degree.
********
Required Disclosure: Stats in the graph and post are not published, verified or compiled by The Northwest Multiple Listing Service.
Once again Ardell’s graphs tell the story-
the kind we all like to see. I hope this is
the start of a more positve RE trend. J-