
The market “recovered” in early 2009, back when I called the “bottom”. Recovery means it returns to a predictable and normal cycle, and stays there for the forseeable future. We are now two and a half years from that “bottom call”, and if I had to describe the Single Family Home market as I did back in February of 2009…there would be little change from what I said at that time.
This is what I said, according to Aubrey Cohen, who is quoting me in the Seattle PI Front Page News Story “Agent Predicts Housing Slumps Demise“.
“…once a house is priced at least 20 percent below what it would have been expected to fetch at the market’s peak in the summer of 2007, it sells” (“bottom” of non-distressed property).
“She said distressed sales were going for about 37 percent below peak, and areas with a large share of distressed sales would see those dragging down prices across the board.” (bottom is 37% plus a continued drag down in areas where distressed sales are a high % of overall sales)
“In her call, DellaLoggia said she’s focusing on the North Seattle and East Side areas where she works.
Again, I’m quoting Aubrey Cohen…who is quoting me back in February of 2009.
If we are still running in those ranges…then the market actually “recovered” in February of 2009, which by and large it DID, depending on your definition of a market recovery.
Recovery does not mean it will never go higher or lower ever again. It means it has stopped the indiscriminate and unpredictable SLIDE, and returned to…a market that moves based on it’s normal basis up and down.
Let’s take a look at 2011 Home Sales Year to Date (Jan 1, 2011 to about a week ago when I ran these numbers and created the charts and graphs.)
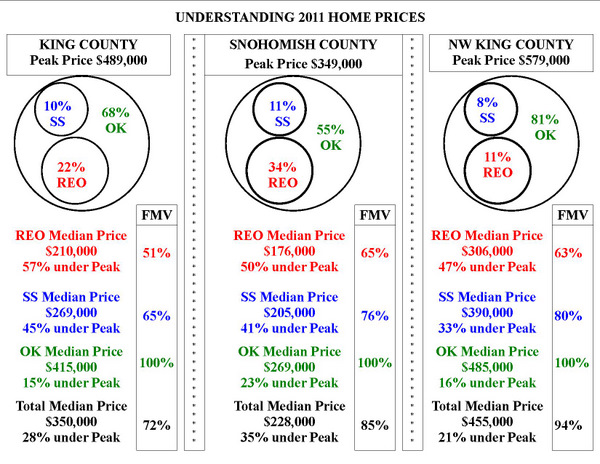
The last column, described as NW King County runs North of the I-90 Bridge to the end of King County going North and West of Lake Sammamish to the end of King County to the West. I would probably include Issaquah and Sammamish and Mercer Island in there as to markets performing similarly, but to define it in a solid block I drew the map search as defined above.
Are we still “at bottom” of if it is priced “20% below peak” for a non distressed, single family detached home? Yes…2011 prices are running at 16% under peak for NW King.
Are we still “at bottom” of 37% under peak for Distressed Property Sales, Short Sales (SS) and Bank Owned Sales (REO)? Yes…for Short Sales running at 33% under peak. NO for Bank Owned Property Sales running at 47% under Peak. Perhaps Bank Owned property has been damaged more so than homes people still live in. That could easily account for the difference.. As can the true “as is” nature of that particular beast. Those that must be sold ALL CASH as example…can’t be financed due to condition, will run under the price expected if the home could be financed without a “rehab loan”.
MOST IMPORTANTLY if you are a home buyer or seller…you have to note the % of distressed property that impacts YOU.
IF you live in a neighborhood that was built and sold out at PEAK…then your entire neighborhood will be dragged down by all of the short sales and foreclosures around you. IF you live in a neighborhood with 3 healthy sales and one short sale…the impact will be less…much less…perhaps none at all.
As with all of my posts, I try to give you a tool you can use. Take the “appraiser’s area” around your home. Usually that is in increments geographically based on data obtained. IF there are 5 sales within 6 months with 1/4 mile of your home (more true for newer homes built close together), then the appraiser may not leave your neighborhood to find more “comps”. As long is there is at least one within 60 days. Draw the circle and the small circles for SS and REO. Do one chart for 1/4 mile, one for 1/2 mile and one for one full mile. Even if they find 5 sold properties in 6 months within 1/4 more, the may reach out a full mile to drag in some short sales and REO sales for their own protection.
If ALL of the sales are in the SS box on your chart…and you think you are going to price at 20% under peak because YOU are not a Short Sale…no. Not gonna happen.
If MOST of the sales are Short Sale and REO in your chart…and you think you are going to price at 20% under peak…no…not gonna happen.
IF there are TEN sales and ONE is a short sale or REO…and IT sold for 30% to 40% under peak…no, you don’t have to price your home as low as that sale, as long as the other 9 homes sold without impact. You can discard the distressed property and use the other comps…but that doesn’t mean the buyer’s appraiser won’t drag that back in to his appraisal…because he is protecting the lender…not you or the buyer of your home.
********
(required disclosure: Statistics in this post and in the chart in this post are hand calculated by ARDELL and are not copied from data compiled, verified or published by The Northwest Multiple Listing Service.)
I have not read any news if the home prices in Seattle recovered in year 2011. Lower interest rates in real estate market will definitely increase the sales and hopefully this year 2012 will be a better year for the real estate industry.