
King County Home Prices hit a new low in January of 2011. There’s definitely something a little odd going on, as median home prices do not usually fall by $32,000 in one month. But then November and December of 2010 should not likely have gone up as much as they did, unless the market is positioned to start ramping upward, which no one really expects to happen.
The only conclusion is the market is teetering on WTH to we do NOW! …or lot’s of people read my Oh NO! People are starting to overpay for houses again post.
No more tax credits, market should have gone down. But 2010 ended higher than it began. Totally unexpected and irrational.
Take a look for yourself. The blue $ is the King County Median Home Price in Thousands. The red blocks mark the bottom of the decline from PEAK Pricing in July of 2007 to March of 2009 and the second red block is where we are now at the end of January 2011. The first number in each 3 number sequence is number of homes closed. The middle number is the halfway point (median) as to units sold. Some are not exactly half as more than the perfect number sold at the same price to stop at exactly half sold for more and half sold for less.
Example: Jan 2011 824-413-$350 means 824 homes sold and 413 of them sold for $350,000+.
A NEW low!
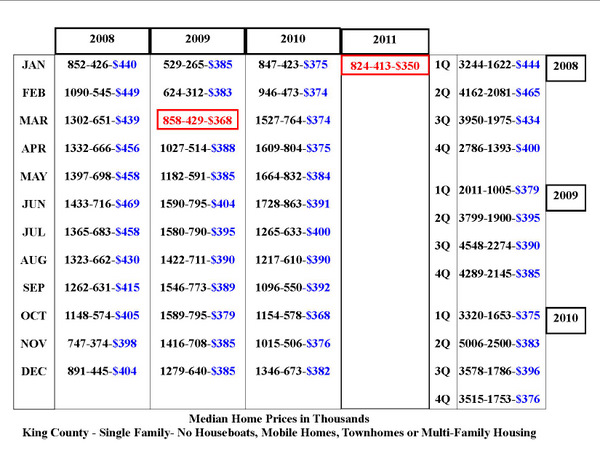
The quarterly median graphs on the right above show you that in a flat market a year ends about where it started as to 1st and 4th quarter and the 2nd and 3rd quarters are usually higher. That is what they call “Spring Bump” and what a “normal” relatively flat year looks like.
Now let’s look at where King County Home Prices are BACK TO with this NEW LOW.
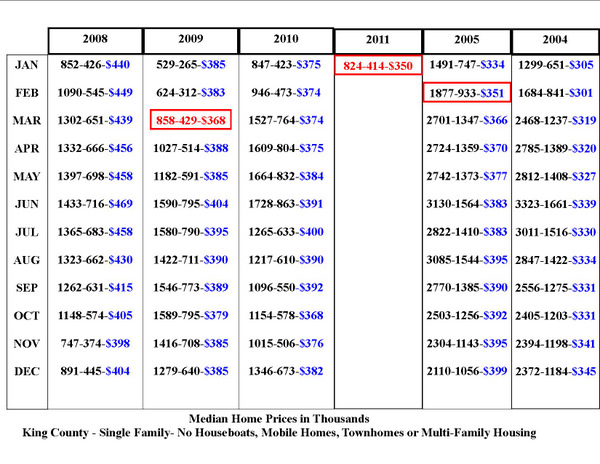
NOT at 2004 pricing YET…but very close. A small $5,000 drop from here will put us at December 2004 level.
At the moment, as you can see in the above graph, we are at February 2005 pricing.
We had been running at or above April 2005 pricing for quite some time. For years…many years,and consistently for the last two years. So this new low is quite a “newsworthy” event.
I think we will “Spring” back up to $375,000ish pretty quickly…but for now, we have a new low. What will cause the rise up? Some people with really nice houses who are not upside down getting on market and listing their homes. There are more buyers today than there are nice homes, priced well, to buy. But I expect that to change, and for prices to get back up to the $375,000 level fairly quickly. If not in February, than by April at the latest.
********
(Required Disclosure: Stats in this post and in the charts in this post are not compiled or published by The Northwest Multiple Listing Service.)
Ardell,
When comparing the Dec to Jan stats in both King and Snohomish County I see that prices always drop. It has done that for the last 10 years, except 2002-2003.
So I don’t see this as unusal, just a seasonal thing. Also, number of sales drops as well, usually about 30% as well.
Julie
Julie,
I don’t think we can sweep this particular drop under the rug as being a normal seasonal shift.
1) Because it is about 3X the norm
2) Because it signals a NEW low in the market that is lower than any price for the past 20 months.
But on the bright side, I hope it leaves us no place to go but UP from here. 🙂
I wonder if the uber-low mortgage rates pushed a bunch of people to buy at higher prices during October and November of last year. If buyers were qualified in the summer, the subsequent drop in mortgage rates might have made people a bit more careless in actual price paid for a house (it might also explain the “overpaying” syndrome that you reported in a previous post). Now that rates are higher again (starting early December), purchase power decreased, which could be reflected in Jan postings.
Probably the biggest influence in January was the % of bank owned and short sales increasing, and the % of those on the low side of the median increasing as well.
In January, 195 were Bank Owned sales with only 40 of them above the median price and 104 were short sales with only 37 of those above the median price. 36% short sales and bank owned property.
That’s up from 28% of December solds being short sales and bank owned, and in December, almost half of the short sales were on the high side of the median price. So December closed out more high end short sales than January, pushing the median up in December and down in January.
Will be interesting to see which way February turns. It should turn up vs down from here. In fact January should end up being the lowest median for 2011.
You point out February 2005 as being about where we are at in January 2011. But February 2005 is 15% higher than February 2004, so wouldn’t you expect significant drops yet to come? Bigger than 5k.
15% in 1 year seems like a bit of craziness yet to unravel.
And if you removed REO and shorts, could you assume that regular sales are still much closer to bubble pricing than we think?
Dweezil,
We sat around 4/05 pricing and above, back and forth, for about two years. So no, I see no reason why we would be doing a 12 month fall back to Feb 2004 pricing in short order. I don’t expect much bigger than 5K lower (and maybe not even that) before we hit Spring Bump, which will push us back up into at least the $375,000 range, and likely higher than that.
Lesley mentioned the play of interest rates, and I do think slightly rising rates causes people to act on fear of higher payments if they wait. So if Inventory is decent, and there are good homes to buy, I think we’ll have a normal Spring Bump Up into higher median prices, as usual in the annual cycle of home prices.
No, I don’t think if you removed REO and Shorts, regular sales are still close(r) to bubble pricing than we think.
(I posted some calculations of “regular” sale pricing vs short sale and bank owned here, but the numbers look funny to me, so I had to delete them and make sure they are right before posting. Don’t want to put up any erroneous info. I’ll double check them in the light of day.)
Before I go further on that, Dweezil. Can you answer this?
You said: “And if you removed REO and shorts, could you assume that regular sales are still much closer to bubble pricing than we think?”
What do “we” think? I think, and have thought and have been quoted as saying, “regular sales” are 20% under peak and Short Sales and Bank Owned property is selling at ‘up to’ 37% under peak”, since early 2009.
Not all sales that are not bank owned or short sales are “regular” sales, as some are Estate Sales and Relocation Property, and not 100% property without the pressure to sell.
In checking recent solds, the median for “regular” sales was falling in the 26% range, so with some allowance for some pressure sales being lumped in to the “regular” sales stats, that seems about right.
The short sales fell at 36% under peak, so that falls well within what I “was thinking”.
The bank owneds were on the low side if I only look at January. But we have already proven, given the huge drop in January, that bank owneds were disproportionately on the low side while December was disproportionately on the high side. That’s where I run into trouble trying to strike a large enough time sampling to create a true picture.
BUT, generally speaking “regular” sales are not falling lower than I think/thought. If you think regular sales should be lower than 20% to 26% under peak, then the answer would be no for me, but yes for you.
So when you ask: “And if you removed REO and shorts, could you assume that regular sales are still much closer to bubble pricing than we think?”
What % under peak are you thinking? I doubt “we” all think the same in that regard. They may be falling a little lower than I was thinking, and a lot higher than you were thinking.
I am completely new to the world of real estate and these types of number crunching, so my math and assumptions are not always correct.
I think I was just looking for confirmation that seeing January 2008 median at 440k vs January 2011 median at 351k is not a fair comparison because of the exceptionally large amount of REO/shorts. Just looking at the numbers, it says a 20% drop.
But it is more likely that the REO/shorts skewed the numbers for ‘regular’ sales. I would expect that regular sales were maybe 10% down(I’m making up this number) with the REO/shorts making it seem like regulars are down 20%. So if the regulars were only down 10%, they would be closer to the bubble pricing than the 20% one would see from glancing at just general median pricing.
Let me know if there is something I am missing.
I see what you are saying. By most accounts, regular sales are down 20% and REOs and shorts are down 36% or so. Regulars are not 10% down from peak, and 2008 was not peak. I don’t have peak numbers in this particular chart, as I’m studying from “bottom” vs from peak for the most part. This is “the new bottom” for now.
So yes, you are missing something because I didn’t include it. Peak pricing was prior to 2008. The abrupt shift in financing guidelines came in around 8/3/2007 and prices were already in the decline during the latter half of 2007. Some areas peaked as early as 2006, but likely because people shifted from buying expensive older homes on larger lots “in-City”, like in Green Lake, to buying cheaper, newer, attached townhomes.
I was thinking longer term, like come February 2012, versus within the next couple months before the Spring bump. It makes sense, as you stated that we could see just another 5k drop before Spring.
If I recall correctly, my summer 2010 predictions were for back to bottom 4th quarter 2010. 5% drop early in 2011. My 2012 prediction was a possible drop of 10% more BUT only if the stock market took a nose dive, and local large companies had layoffs. If the stock market stays above 11,000 and we don’t see layoffs of 10% or more, then no. The stock market being over 12,000 surprises me…I must say. I didn’t expect it to be doing this well. I’m more comfortable with the stock market being at 11,500 or under. It feels a little too high, given what’s going on, to me.
When viewed through the lens of affordability (median home price/median income) we are back at 2000 levels, when the ratio for the seattle Tacoma Everett area was 4.3 (median home value divided by median household income). We are currently about 4.6. National historic norms were around 3, but significant and largely permanent variances occur in coastal metro areas (San Fran, LA, NY, Boston, etc). The rough average for the 90’s was 3.7., which sets a reasonable floor for the area median pricing at around $300K.
Without more recent data, I am using $80K for median HH income, from 2008.
Yes, King County is different (higher median home price and higher median income) from Pierce and Snohomish counties, but I don’t have the data to say by how much.
Ardell, any idea how much Pierce and Snohomish differ from King in incomes and home pricing?
Let’s change that tune a little. Not everyone with “an income” is expected to earn enough to buy a home.
Let’s say that median income is $80,000 and that if you break it into quarters, the median incomes fall at:
25% make $40,000 or less
25% make $40,000 to $80,000
25% make $80,000 to $120,000
25% make $120,000 to $160,000
In reality the 1st quarter would not start at zero, so the above numbers lean to the conservative vs being overstated. For $80,000 to be a “median”, then 1/2 the people must make more than that.
Now let’s rule out the entire first tier as not being able to buy a home at all when making $40,000 or less.
Let’s rule out HALF of the 2nd tier, and call minimum income needed to buy a home at being at least $60,000.
Let’s say all of the people in the upper two tiers can buy a home.
Now we take 62% of the people, as only 62% earn enough to actually buy a home, and call that income base $60,000 to $160,000 and strike the median income of people who can actually buy a home at $110,000 with 1/2 earning more and 1/2 earning less.
That gives us $330,000 as 3X income. Now let’s assume at least 1/3 of those people have 20% down and NONE have zero down. So $330,000 is the median LOAN amount, not the median purchase price.
Most people qualify for 3X to 4X annual income, not 3X. 3X is a good conservative rule of thumb, but most people fall closer to the 4X, unless they have a substantial downpayment.
The problem with the “lens of affodability” argument is that it starts at a point where no one can buy a house at all. If you start at the minimum needed to buy a house…I’d be with you. But median price ONLY counts people who are actually buying homes. Comparing THAT base to the income of people both buying and not buying, does not give you an accurate result.
As to Pierce and Snohomish. I never work in Pierce and only sometimes work in Snohomish, so I leave the discussions of those Counties to agents who actually work those areas. When dealing in numbers and research, one has to have a general idea of the income base and property in the study. I can’t do that for Pierce.
In “my world”, which is basically all of North King with a smidge into South King and a simdge into Snohomish, the median home price is $415,000 and the majority of people are not buying via FHA. I would say, based on spot checks I have done over the last two years, that at least half are buying with 10% down or more. Many have a household income of over the $160,000 noted in my figures, but they do not spend as high of a % of their income on housing as those closer to the median.
So given the reality that median price is $415,000, I don’t have to figure out why that is less than some census’ idea of median income. The more solid truth is that home prices do not correlate to median income when taken from the low point to the high point, including people who are not buying homes at all.
Monthly rental prices will fall more in line with overall median incomes than home prices.
Ardell,
2005 prices is not bad at all. And yes there may be a few more thousands left to go. Here in Northern NV it’s at 2002 levels.
Ok, we’re number one in the nation in futility but roughly your market has only decreased by half compared to us. And you mentioned “We had been running at or above April 2005 pricing for quite some time. For years…many years,and consistently for the last two years.”
Personally, I think that deserves more credit. If market has remained fairly steady in the last two years, that’s a very positive sign. Even if it falls $5,000 more — it could also mean a minor downward spike, It’s worth watching if it goes back up to $2005 levels. Or not.
Who knows. Let’s just watch what it does.
Good post…
Pingback: Real Estate – The #1 Question | Rain City Guide