
We dug into the numbers on the Estately blog to see if we could make sense of the Seattle real estate crunch we’ve been hearing so much about. The summary: the market looks healthier this year than in the previous two and, in the first week of March, a whopping 1 in 3 homes sold for above the original listing price. We are looking at homes (not condos or townhomes) in Seattle and King County (excluding Seattle).
The numbers paint the picture of a recovering market:
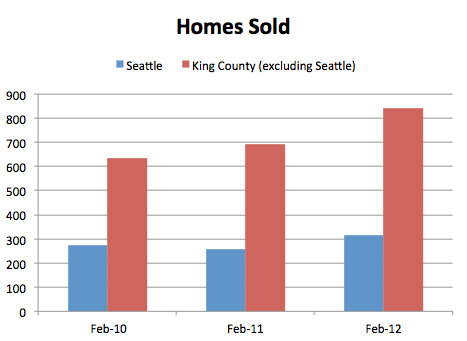
1. Increasing numbers of homes sold, year-over-year…
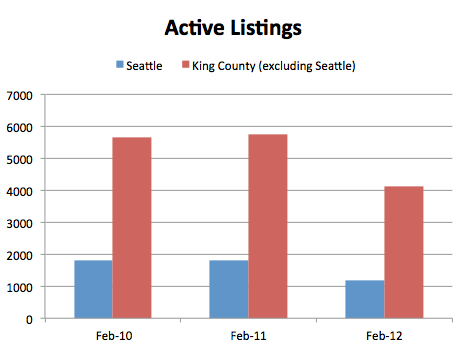
2. … And less homes for sale…
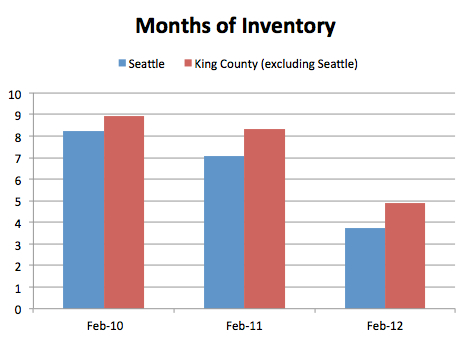
3. … means dramatically lower inventory:
These stats not compiled, verified or published by The Northwest Multiple Listing Service
Hey Galen! Great to see you!
Similar to my recent post…more selling = fewer for sale. I’m on constant looking for new listings and sorting old listings with different filters 3 to 4 times a day.
Totally like your post – I meant to mention it here. Nice to see you too! 🙂
I like the validation of a separate source and thought process. 🙂
Can you do inventory adding back listed and gone pending during the month? I think that is the point of clarity, but hard to do. I don’t see anyone putting out that info. Everyone is showing the net result on inventory without counting the inventory that came…and went during the given month.
So you mean a chart overlaying the number of new listings and number of gone pending listings every month? I like that idea.
To track “real” inventory MOM it would have to be the Pendings that also listed during the same month. The ones that listed and went pending in 30 days or less. Not the ones on market for 4 months that went pending during that month.
I’m reading articles saying “low inventory” as if no one is putting their home on market. But with the increased # of property sold YOY, it doesn’t seem right to not count the house that listed on Feb 3 and went pending on Feb 12. I can do it for small areas, but you have to do it by hand. 🙁
I tried doing it by Days on Market of 30 or less, but that function doesn’t work at 100% accuracy. Not sure why.
It's great to see you writing Galen....nice post....fits well with Ardells...
Your absorption rate (months of inventory) is really impressive. Here in my part of Florida we’ve seen some tremendous improvement, but still running a 10 month inventory.
That’s such good news. I checked Google search trends a few days ago as a future market indicator. The term “custom home builder seattle” has showed geomotric increases in search colume for the last three months (Dec, Jan, Feb) of this year.
That indicates that people are actively involved in the pre-construction research phase for a new, custom home. That is abviously great news. When I spoke to a builder I know about my findings, and that the markt would be on the upswing soon, he said “I hope it gets here fast!”
Your data shows that maybe it alread has. In the south end of King county, the low end has picked up nicely, with many new home communities in Kent and Renton doing very well. Despite the increased construction, there are relatively few unsold homes sitting there.