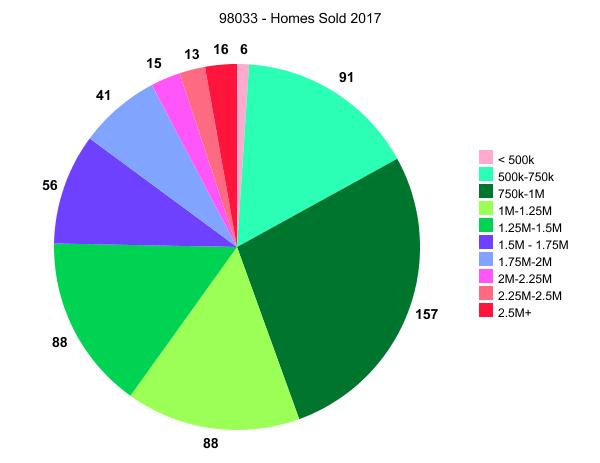
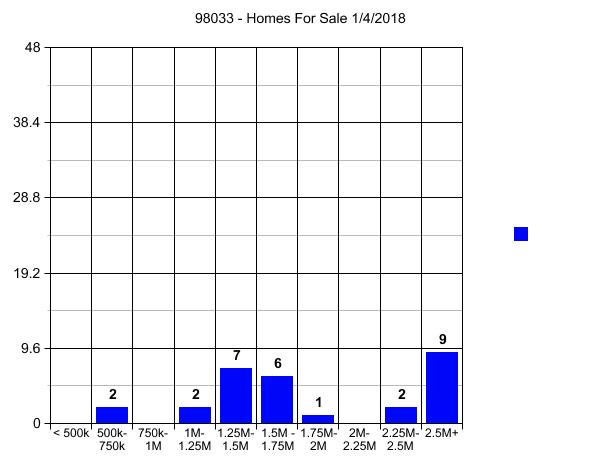
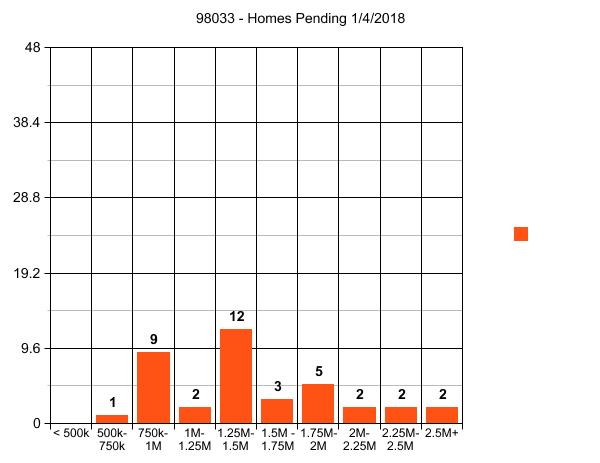
 I have jumped ahead from near the end to post this at the top. Notice that the movement in 98033 pushes the prices in 98034 with a one year lag. The huge movement in the 2014-2015 period in 98033 caused the same movement in 98034 in 2015-2016. We saw this before in the last bubble, especially in the condo market. When Downtown became too expensive the Juanita Beach area started pushing up to a greater degree. But I’m jumping ahead…back to the beginning.
Here is a map and description of all of the neighborhoods of Kirkland from the Kirkland City site. I find “by Elementary School” in Lake Washington School District to be more relevant to prices than “Neighborhoods”, so I will be using “by Elementary School” for price stats near the end. The links above give you the Neighborhood Maps, the School Boundary Maps and the School Rankings in case you need a little help relating the data to the specific price areas.
We’ll start with the broadest area, all of Kirkland, pulling the data by the two Kirkland Zip Codes of 98033 and 98034 separately. Generally speaking one would expect 98033 homes to cost more than 98034 homes when looking at the area median home price. That has more to do with proximity to Downtown and more land area with views and access to Lake Washington than most anything else. Let’s see if that continues to hold true in 2017, while at the same time calculating rate of price growth over the last 5 years. For consistency I will use a 12 month rolling basis from 9/16 to 9/15 but will call the year by it’s end date.
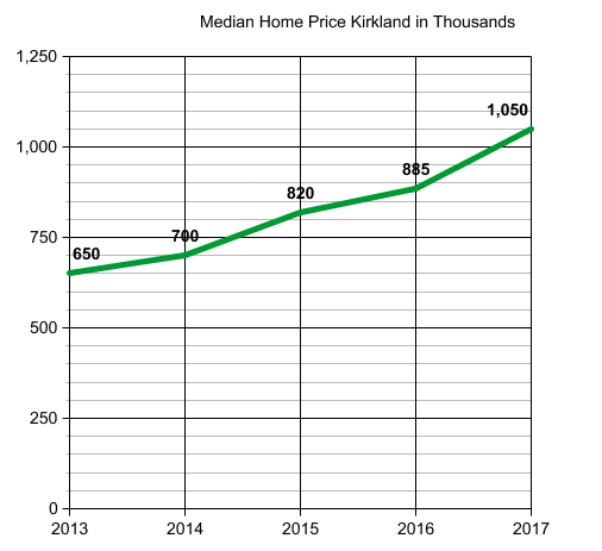
For 98033 the current 12 month rolling median price in Kirkland 98033 is $1,050,000, up from $650,000 5 years ago.
In addition to knowing the median price (half sold for more and half sold for less) I find it more relevant to know the price at which MOST people purchased and for how much. Doing this for 9/16/2016 to 9/15/2017 – 12 month period – and not for all five years. Here is where we have been in the last 12 months as to who bought and for how much in 98033.
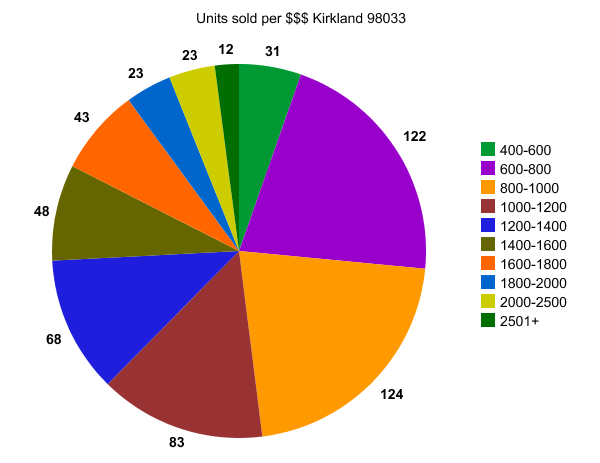
To break the above pie down even further, 23 of the 31 “up to $600,000” were between $500,000 and $600,000 and only one was $400,000 or less. 69 were between $700,000 and $800,000 and 74 were between $800,000 and $900,000. About 45% were between $600,000 and a million.
NOTE: Median Condo Price for 98033 for the same period was $625,000.
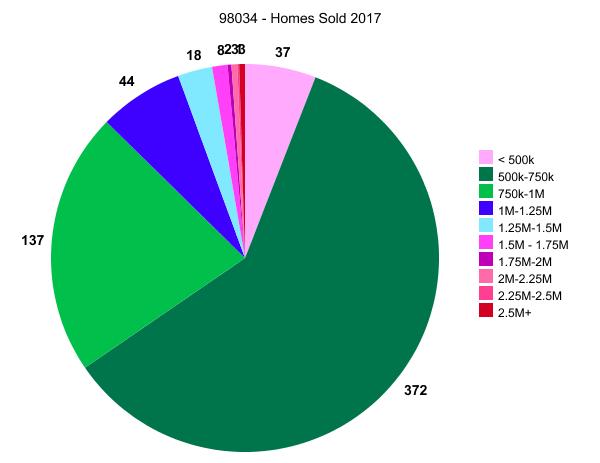
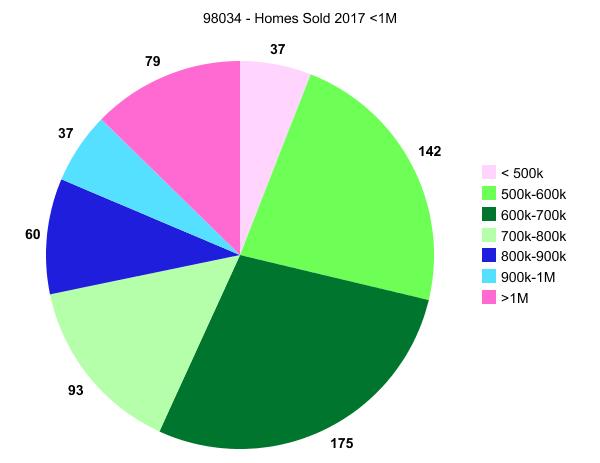
Running the same numbers for 98034. …the results are pretty astounding so I’ll post those before the commentary. I am calculating the data as I type this and I adjusted the visual a bit as to coloring on the pie graph so that you can see more clearly the part I find pretty astounding. Showing the results side by side.
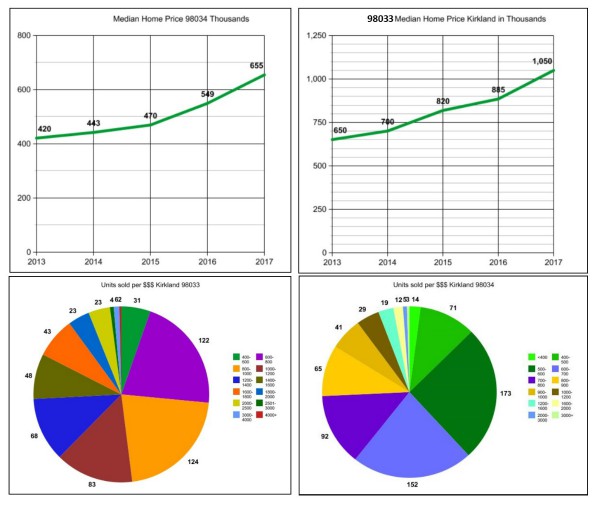
Restating the 5 year growth for Kirkland by Zip Code on the same chart vs separately so that the visual is more relevant with the end amount being consistent for both. For kicks I added the 2002 median price as the start point so we can compare the last 5 years with 15 years ago.

I moved that graph to the top as well for people who just like to glance and go.
I want to move on to Bellevue and Redmond to compare to Kirkland, but I promised prices by Elementary School back at the beginning. I did this one back in March by Average Price vs Median Price and will try to come back and update it. But for now it gives you a rough idea of the variance from one Elementary School Boundary Area to another. As you can see from the dot to dot, 9/16 to 9/17 had a 19% push up in both Zip Codes equally. So I’d say add 10% to those March 2017 Average Prices in the bar graph for now.
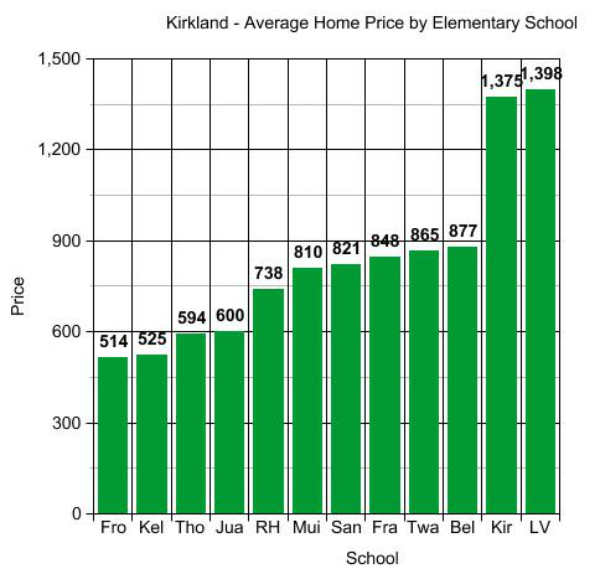
Here is the key. To see where these fall geographically go to the Lake Washington School District Boundary Map though for some reason the “new” map seems to be a lot harder to follow than the one I’ve used for many years which was interactive. For now I’ll just throw the Zip Code on for you.
Fro = Robert Frost Elementary 98034, Kel = Helen Keller Elementary 98034, Tho is Henry David Thoreau Elementary 98034, Jua is Juanita Elementary 98034, RH = Rose Hill Elementary 98033, Mui = John Muir Elementary 98034, San = Carl Sandburg Elementary 98034, Fra = Benjamin Franklin Elementary 98033, Twa – Mark Twain 98033, Bel = Alexander Graham Bell 98033,Kir = Peter Kirk Elementary 98033, LV = Lakeview Elementary 98033
The large marjority of homebuyers are choosing by Elementary School and Elementary School rank with an overlay of commute considerations. So breaking down price by Elementary School becomes important so a buyer can readily see that the price tag of Lakeview Elementary is much higher than the price tag of Sandburg Elementary, as example. But calculating the median price by school boundary is extremely tedious, so here is March 2017 and I’ll try to do all of the polygon search fields by year end.
There’s Kirkland at a glance. I find all this ridiculously fascinating though I think many would be bored by now. I run these numbers for myself to keep my perception in line. Even though I do this all day, every day, out in the field, it still amazes me when I line up the data.
It’s always good to check and correct your perspective…as often as possible. I do it for myself…but hopefully you enjoyed at least some of it. 🙂
Required Disclosure: Stats used in this post and graphs are hand calculated by Ardell and not compiled, verified or published by The Northwest Multiple Listing Service.

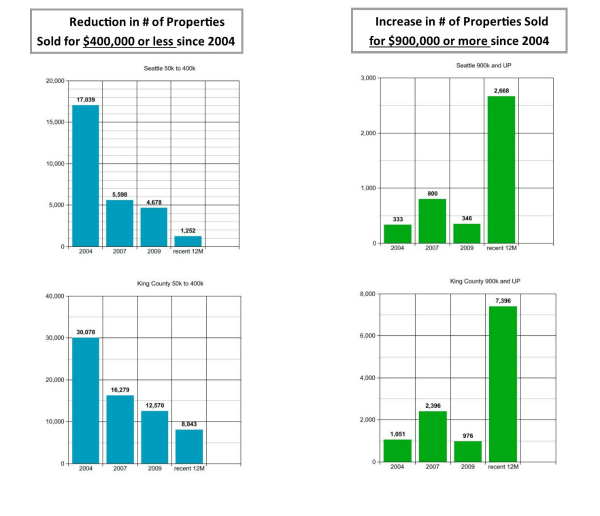

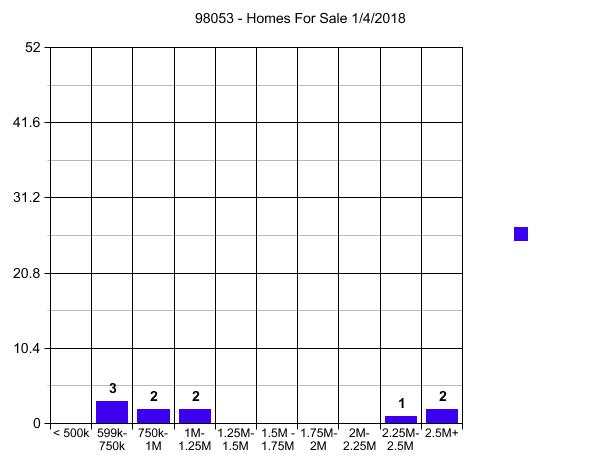
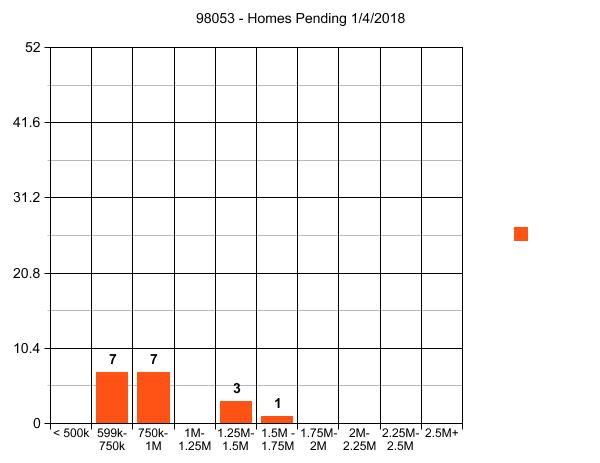
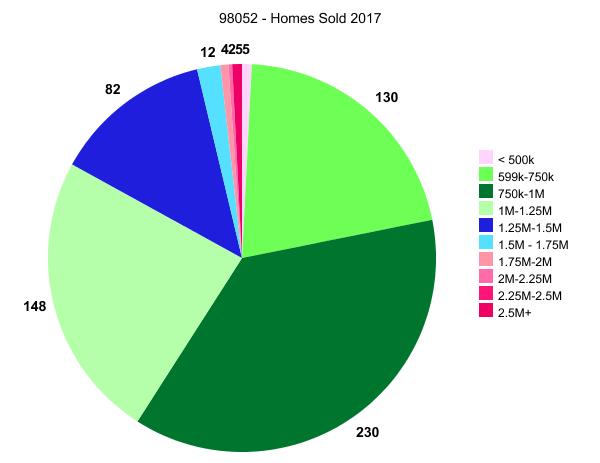

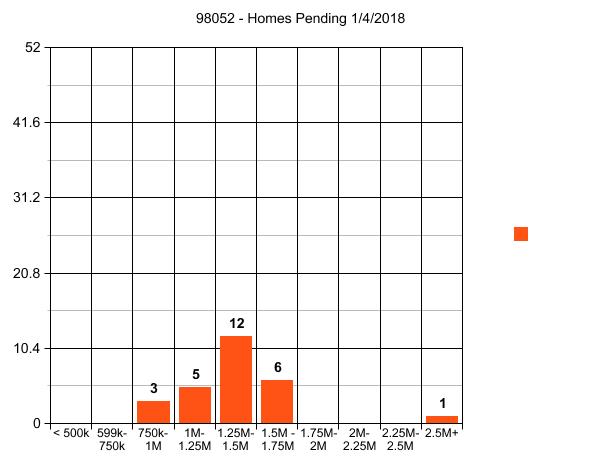 2018 Home Prices in Kirkland 98033