About ARDELL

ARDELL is a Managing Broker with Better Properties METRO King County. ARDELL was named one of the Most Influential Real Estate Bloggers in the U.S. by Inman News and has 33+ years experience in Real Estate up and down both Coasts, representing both buyers and sellers of homes in Seattle and on The Eastside. email: ardelld@gmail.com cell: 206-910-1000

You should NOT be buying a house if you don’t “get” this.

Why did so many people buy houses they couldn’t afford? I’m not talking about people who bought 5 houses to “FLIP”, or the cash out refinance issues. I’m talking about the basic Buy A House to Live In IT bunch who never did a cash out refinance.

Well…on 2nd thought…let’s leave those cash out refinance people in, as this “study” may explain WHY so many NEEDED to do a cash out refinance, and use their home as an ATM machine.

Let’s start with the basic MODEL and examine where everything started to go sideways.

Qualifying for Mortgage Chart

Qualifying Ratios ONLY WORK well when THE MIDDLE COLUMN is in sync.

Now that the dust has settled and we are not looking for some ONE to BLAME, let’s look at the REALITY of what, exactly, is broken…so YOU can fix it. This is about you, as a buyer of a home, as you are the only one who can proceed on the RIGHT basis. No agent or lender can sort out that middle column for you. You must make the extra effort to QUALIFY YOURSELF!

Here’s what happened, in a nutshell. EVERYONE’S BACK END WAS OUT!!!

Used to be, looking at my Chart inserted in this post, that IF YOUR DEBT PAYMENTS caused your TOTAL of housing payment + Debt to exceed the “back end allowance”, your housing allowance was REDUCED accordingly.

EXAMPLE: Housing payment $2,800 (column one) Debt + Housing $4,000 (vs the allowable $3,600 in the Chart’s middle column) equalled a REDUCTION in allowable housing payment from $2,800 to $2,400. 28% of Gross Income was ONLY the allowable amount IF your housing payment plus monthly recurring debt payments did not exceed 36% on a combined basis.

If you do not understand this up to this point, PLEASE, PLEASE ask questions as you should NOT be buying a house if you do not understand this. If you are not capable of understanding the basic accounting framework of home buying and home ownership, then do not buy a house. It really is THAT simple.

The Middle Column went out of whack when people started using their Credit Cards for Column Three items. Before ATM cards, people did not do that. Credit was for buying a home and LARGE purchases and MONEY was for buying everything else. Front End + Back End assumed that no one would buy a carton of milk or a loaf of bread on a credit card. Front End and Back End assumed that no one would use a credit card to go to a movie theater.

That said, what YOU need to do is look at your Total Credit Card debt and separate the balance into “used for LARGE purchases” vs “used for column three expenses”.

The Lenders and the Real Estate Agents really can not do that for you. So what they DID (which proved to be disastrous) was EXPAND the back end ratio to include the usage of credit cards for column three expenses. This started when people LEASED cars vs buying them. Given you did not OWN the car at the end…this shifted the car payment from a column two expense to a column three expense.

Column Two is for large PURCHASES! Leasing a car is NOT a “purchase”. Seriously…that was the EVENT that created a huge disconnect for Qualifying Ratios, combined with people not making a distinction between when they were using a Credit Card vs an ATM card for minor purchases. Going to the movies is not a LARGE PURCHASE worthy of using a Credit Card vs a Debit Card.

There’s an old saying: “One Step Forward; Two Steps Back”. What I am suggesting here is that we have taken Two Steps Forward, and need to take One Step Back. Reconstruct your Credit Card debt to LARGE purchases only. Do not buy a house until your small purchases and living expenses of Column Three are NEVER “financed”.

If you NEED to buy your food with a credit card…you should not be buying a house. It’s THAT simple.

********

Column Three went out of whack for a number of reasons, mostly related to Column Two events as noted above. The MAIN Column Three disrupt, not associated with Column Two, is about EARMARKED savings.

Used to be people had a “Christmas Club” savings account and a “Vacation Club” savings account and an Emergency Fund Savings account that was never touched except for dire emergency (and then repaid BACK into the Emergency Fund), and a Short Term savings account for “luxury items” and a Long Term Savings Account for retirement.

Buying a boat was a “luxury item” vs a “Large Purchase”. “Large Purchase was a refrigerator, a washer and dryer, a bedroom set, etc. Things you needed long term, not things you WANTED long term. You saved for a Luxury Purchase – a large item that you WANTED and you charged a NEEDED large item to spread out the payments.

Two things largely contributed to the demise of Americans saving money and saving it in an earmarked way. One was the change from the standard 5% interest bearing passbook savings account. The other was the expansion of bank charges per account, that caused people to lump their savings into one account vs earmarking it by spreading it out among several designated purpose accounts. There was never a charge for a “christmas club” or a “vacation club”, and with 5% interest, people saved for those things vs charging those things.

A third thing that changed was the ability for a homeowner to convert their non-deductible charge card interest to deductible “mortgage” interest via a “cash out” refinance to “consolidate” debt. Seemed like a financially “smart” thing to do…until your house was “upside down” and you needed to do a short sale. Ask yourself how many short sales are done to “forgive” the car loan and the student loans that were combined into their Mortgage Amount? That is a frightening thought, and not about a HOUSING Crisis at all!

Is there any hope for a true FIX? The answer is likely HIGH INTEREST RATES are needed. When interest rates are high, people save more. When interest rates are high, people put the right amount of forethought into buying a home.

For that reason I have to say that keeping interest rates low and fixing the economy all at the same time is an oxymoron. I don’t want to see interest rates go to double digits, but until interest rates are back in the 7% to 8% range, I don’t see much hope for an overall “fix”. BUT, hopefully, if you “get” what I am saying here, you can at least fix it for YOU.

Also, an up front Tax Credit to REPLACE the Mortgage Interest Deduction would go a long way to preventing homeowners from creating an Umbrella Loan for their Car and Education and other non housing related debt, in order to qualify the interest paid as a “mortgage interest” deduction.

If you understand the chart above, and keep your “back end from falling out”, you will clearly be a Giant Step ahead of most of your Peers. It’s a NEW Decade. 2011 is the year of One Step Back to Sound Principals and reliable fundamentals. Good Luck with that. If you don’t understand any part of this, please ASK!

Happy New Year!

The 2009 Version of the “same” principals

Can you modify the ratios from those in the Chart?

Half the battle is “won” when you know WHEN you are STRETCHING, and by how much.

Give Warmth – Got Coat?

The Give Warmth project starts today, December 16th, and coats can be dropped off through Wednesday December 22nd.

The “Give Warmth” project will help to insure that needy families will have proper attire for this particularly wet and harsh Seattle Area winter. Can you say La Nina!?!

1) The coats DO NOT have to be new! Used coats in good condition are welcome and appreciated.

2) Coats brought to the drop-off points will be given to and distributed by Friends of Youth in Redmond

3) Give Warmth – Coats for Christmas drop off points are at Carolann Joy Salon in Redmond AND at Cafe Ladro in its newest location in Bellevue

More details regarding drop off locations and times are in the video and the links.

What I like THE MOST about this particular Holiday Giving Event, is this one does not require YOU to spend ANY MONEY to help others this Christmas. New coats are great, but used ones in good shape are appreciated just as much as new ones!

Who doesn’t have a coat or two that wasn’t worn much and is not being used? A great low or NO cost idea for neighbors helping neighbors.

Thank you everyone, and Happy Holidays!

Urban Gardening…The Seattle Way

Urban Gardening in the City of Seattle has gotten VERY creative. I’m not sure this is legal…but regardless, I think it is GREAT!!!

I’m talking about that strip of usually very ugly grass “on the street side of the pavement”. I think it technically belongs to the City and not the owner who is “gardening” there. But isn’t this awesome?

Seattle Urban Gardening

Seattle Urban Gardening

It’s supposed to(and most often does) look more like this:
DSCN0301

But look how creative this neighbor is! In that small space between the sidewalk and the street curb, they managed to grow cauliflower, cabbage, corn, sunflowers and even watermelon! Again…not sure it’s “legal”…but it’s super-awsome!
DSCN0302
DSCN0303
DSCN0304
DSCN0305
DSCN0306

Townhome Prices – Green Lake et al

Home Prices in 98103 – There’s hardly a person in the industry, or who is thinking about buying and/or selling property in King County, who isn’t asking the question: “Where are home prices right NOW?” There’s a lot of speculation about the impact of the end of the Tax Credit on home prices. But what we need are real facts in real time.

We also need to know if there are any indicators, be that a Zillow Zestimate or a Tax Assessed Value or other valuation tool, that will help the general public know within a reasonable degree of certainty if a home is “priced well”.

This will be a series of posts in an effort to answer that question. The stats will be for closed sales within the last 30 days, so the number of properties will differ by the volume of sales in each given category.

In the Chart Below we are looking at:

Sales closed within the last 30 days – currently recorded as such in the mls
Type of Property is “Townhome”.
Area is Zip Code 98103 Specific neighborhoods per the listings are Green Lake, Fremont, Phinney, Greenwood. (Note “Green Lake” is a loose term, as the townhomes shown as Green Lake are actually further north into Licton Springs/Northgate in this sampling)

Are properties selling for closer to the Zillow Zestimate? The current Tax Assessed Value OR the previous year tax assessed value? Maybe it’s the Redfin AVM price or eappraisal? If any are close enough to be considered “right”, they are noted in blue.

We will study all info available to the public and see if we can come to any conclusions regarding accuracy, as compared to what the home actually sold for, within the last 30 days.
98103 - townhomes

This is a modest sampling, and we will need to review many more statistics in different places geographically and different styles of property to form any real conclusions.

Surprises? I was surprised that the one Bank-Owned sale was not more of a screaming deal (notes as B/O in the right margin). From my persepective, I am not necessarily looking for who is “right” as much as I am looking for a source that buyers may have decided is most credible when making an offer. I will need to do at least a dozen of these posts to form any real conclusions on that.

(required disclosure: The stats in this post and in the graph are not published, verified or compiled by The Nortwest Multiple Listing Service.)

How To Begin the Home Buying Process

Unfortunately most agents are trained to have a buyer make a list of everything they want in a home as the first step in the home buying process. Left to their own devices without this “push” in the wrong direction, RARELY does a future home buyer start by making a long list like that. It is a “sales” tool to lock you into a close-able position. Don’t buy into that logic by handing a “salesperson” a big list of what you “want”.

Three of the most common “first steps” to buying a home in my 20 years in this business have been:

#1 – Highly Ranked Schools

There is always a lot of controversy surrounding the topic of “best schools” as determined by a ranking system or online school ranking site. Still, many parents use these sites when determining where they are going to be buying a home. My clients tend to use a combination of these two sites:

GreatSchools.org ranks the schools on a scale from 1 to 10. Yes, I have actually seen a school on The Eastside ranked as “1” on a scale of 1 to 10. Makes you want to go peek in the windows and see what the heck is going on in that school. There is also a “star” system, but that seems to be generated by parents whose children already go to school there, so take that with a grain of salt and read the full comments of the parents vs the “3 star” or “5 star” ranking.

There may not be much difference between a 10 ranked school and a 9 ranked school…but clearly there must be a difference between a 10 ranked school and a 4 ranked one. If you love a house in an area serviced by a school ranked from 1 to 4, at least go to that school to try to determine why it has such a low ranking. You WILL get more home for your money if the school is ranked lower but each buyer has to decide where their priorities lie. For many…it is best school their money can buy vs best home regardless of quality of school, and the price per square foot of the home will often reflect that difference.

Another site my clients use, and they usually use both sites for comparison purposes, is:

SchoolDigger.com I like the 1 to 10 ranking system of GreatSchools.org better than the 1 to 5 ranking system of SchoolDigger.com, but I LOVE the display on a map of the schools with “balloons” showing the school ranking. Gives you a better visual of where that you can then match up to a home search map tool. I wouldn’t use these sites to look for homes though. The best real estate search tool for many, many reasons is Redfin.com, but my guess is if you are reading a real estate blog like this one…you already know that.

Even if you do not have children in school, you need to be aware of the impact of school rankings on home values so that you are using the correct “comps” when determining a fair price for a home. You don’t want to use a 10 ranked school as a comp for an offer to be made on a home in a 2 ranked school! Unfortunately, even appraisers haven’t learned that one yet. Be ahead of the curve. Do not be fooled into thinking that “School District” is the ONLY criteria to be used. There are often major variances within a school district.

Some School Districts like Lake Washington School District have a great online map of each school’s boundaries. Boundaries do change from time to time, so be sure to check with the district once you have found a home. Give them the exact address and know that if you are on the border between two schools vs dead center in the middle of the defined area…well, change happens and likely more near the edge lines. This is most important for people planning to have children or who have very young children who are not yet in school.

#2 – “Close-in”…or not “close-in”.

Wanting to buy a house that is “close-in” is more often a “move up buyer” request than a 1st Time Homebuyer request. Sometimes it is the opposite. They bought “close-in” and now want to be far away from “it all”. Unfortunately some learn the hard way how important it is for them to be close to or far away from…something. Everyone’s something is different. First Time Homebuyers tend to look at the WHAT vs the WHERE, and often end up someplace they hate being, causing them to rethink that where and move “out” if not “up”. In fact going from a bad “where” to a good “where” often means moving UP in Price but DOWN in home quality, size and amenities. The wrong where often results in more home for the money, which is why First Time Homebuyers tend to choose them more than experienced homebuyers.

You will often see “Great ‘close-in’ location!” in a real estate ad. What “close-in” means is different in each area. On the Eastside it could mean close to Microsoft, close to Redmond Town Center, close to Downtown Kirkland. On the Seattle Side it usually means you can walk to a coffee shop (and other shops). For those who don’t expect to walk to work, “close-in” could mean a reasonable bus or drive commute time. NOT “close-in” is a little easier to describe than “close-in”. If you have to drive for a half hour to get some milk…you are NOT “close-in”.

There are many variances on this “close-in” theme, and they are as different as people can be different. It’s a personal decision that you REALLY need to spend a lot of time thinking about. Some people hate the noise level of being too “close in” to shops that can also have very noisy restaurants and bars with drunk patrons very late into the night. Some people like to walk to enjoyable amenities, but be as far away from work as reasonably possible. Some people like to be very close to work, but in a private and quiet location when they get home and NOT close in to noisy businesses.

If there is ONE HUGE MAJOR MISTAKE of homebuyers that stands far and above beyond the rest of the mistakes you can make, it is to look at “a house” and make an offer on it, without adequately discovering what is around it. The MINUTE you think you may want to make an offer on a house, spend as much time as possible around that house before negotiations are complete and the home inspection “out” phase is passed. Park your car in front of the house and take long walks in every direction. Say hello to the neighbors. Don’t be afraid to do that! You don’t need to 3rd degree them with a list of questions, nor should you do that. But you should knock on the door and meet the neighbors to see if there is anything alarming to you about them. Why don’t people do that? No one wants to be “close in” to a problem neighbor…no one.

It’s very simple to get “drive times” now without having to leave your computer. Just put in the address of the home and various destination points into a service like Bing Maps and it will give you the estimated drive time. Be sure to double check that during rush hours IF you plan to be driving to and from during rush hour.

#3 Style of Home

Once you determine your suitable where(s), it is time to study the potential whats of that where that are IN YOUR PRICE RANGE.

IMPORTANT NOTE: Many homebuyers are afraid of Future Home Values. Take note that IF you buy a split entry home for too close to the max price for that style of home, you will not likely be able to get paid back for those improvements when you sell.

Yesterday I posted some rather harsh realities for people who want to be “close to Microsoft Redmond Campus” as in within a 2.5 mile radius of 148th Ave NE and 36th. Of great significance is the age of home possibilities.
microsoft age

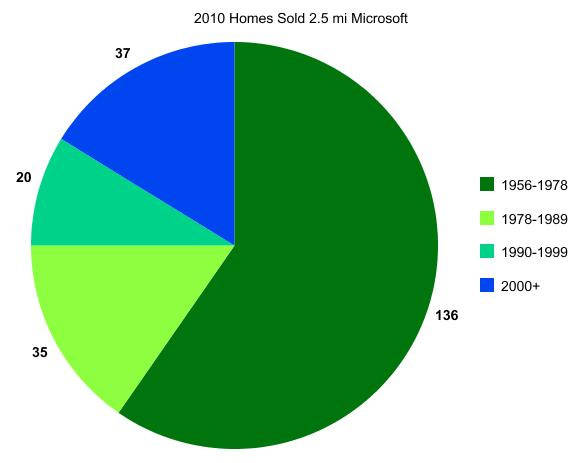
As you can see in the chart above, a large majority of the homes available and sold in that area were built more than 20 years ago. So wanting a house not more than 10 years old within a mile or two from work at an affordable price may look great on your “WANT” list…but easier said than done. That is why it is important to study the makeup of the area you choose, before going out to look at homes.

Besides the age of home, the style of home is also an important factor. You may “like” granite counters and stainless steel appliances…but that is NOT “real estate”. Way too many people choose a home by its “finishes”. A newer 2-story home that has laminate counters and ugly carpet MAY be better than a less favorable home style with hardwood floors and granite counters, depending on your needs and price range.

BIG NOTE: IF YOUR BEDROOMS (AT LEAST 3 OF THEM) ARE NOT A FULL FLIGHT OF STAIRS ABOVE YOUR KITCHEN AND LIVING AREAS…IT IS NOT, NOT, NOT A 2-STORY HOME! I have met many a seller in a Split Entry or 1 story with basement who said “we have always called it a 2-story home”. Reverse floor plans, and I have seen several on market recently, are a little harder to define. If the view from the main level on a reverse floor plan is knock your socks off awesome…well, let’s just say it better be.

Here are 3 examples of how to look at the general range of possibilities before going out to look at homes to buy.
microsoft type

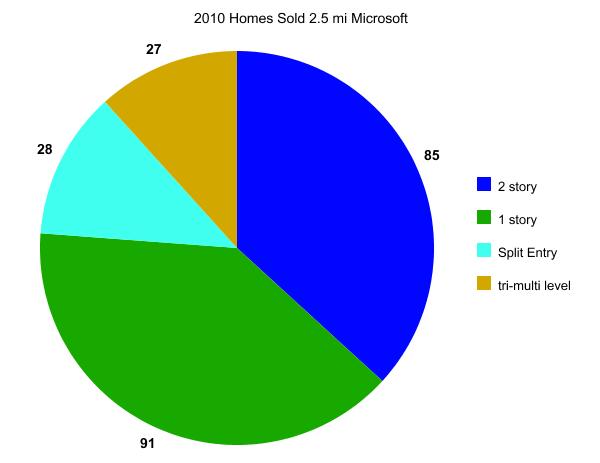
In the pie chart above you can see that the majority of homes in that area (within 2 miles of Microsoft) regardless of price, may be a home style that you simply do not care for. It is important to know that before going out to look for your “ideal home” in an area that may not have it in your price range. Do you go further out to find “it”…or do you stick to living near work? A personal decision you should make before going out to look at homes. Have a backup plan!

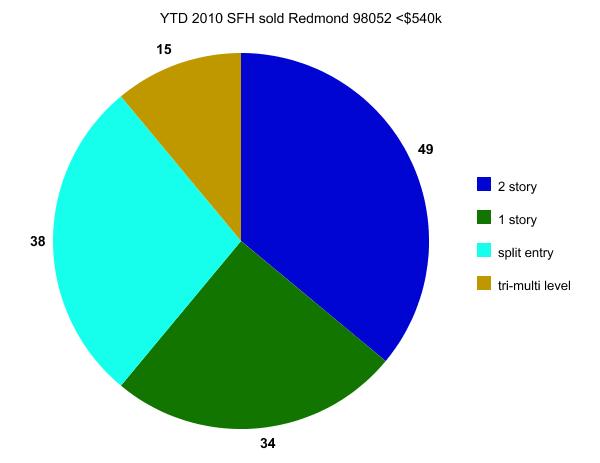
Besides availability, there is a matter of cost. Below I charted all of 98052 using the current YTD median home price of $540,000 as a guide. This first pie chart below breaks down the style of homes sold so far in 2010 costing $540,000 or less in Redmond 98052. Often 2 story also equals “newer home”. Not always…but often…on the Eastside vs in Seattle proper.

graph (8)

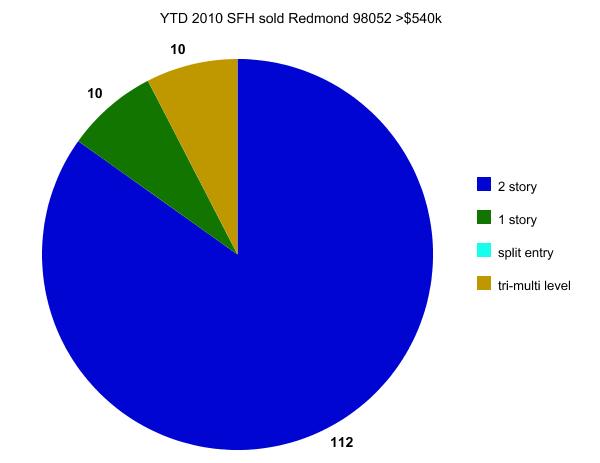
Once I go over the median home price, the breakdown of home style changes dramatically, as shown in the pie chart below. This is VERY important to home buyers in the first group. IF you bought the highest priced Split Entry home UNDER the median home price…note that NO Split Entry Homes were sold above that median price YTD 2010. Future home appreciation is not simply about “the market” as a whole. There is a point at which there simply is no room for upward movement given you simply cannot compete with newer homes and newer home styles regardless of how you may improve that home.

graph (9)

It is pretty simple to graph out your potential and likely choices in your price range in the area you hope to live. It’s OK to look for a needle in a haystack…you just have to know that before you begin the process. What has NEVER happened in the past, is not likely to happen in the near future. If 1% of the people were able to do what you are trying to do, that is important to know the same as it is important to know if 60% of the people were able to do that in recent history.

You clearly will be able to change what you “WANT” a lot easier than you can change the makeup of homes built in a given area. If it never was built, you likely can’t buy it. So do your homework before you step out the door and get caught up in making quick on the fly changes in your overall home buying plan. Be prepared and you will make a wiser choice.

********
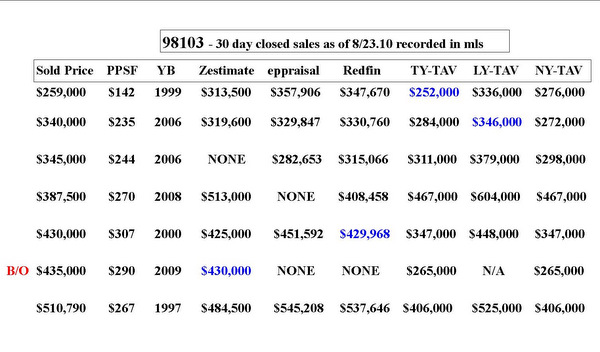
(required disclosure: The stats in this post and its graphs are not compiled, verified or posted by The Northwest Multiple Listing Service.) They are hand calculated by ARDELL.

Truliaboy Refinances His Short Sale Purchase

Truliaboy PuppyBack in early October, I wrote a brief story of a young man (whom I have dubbed as “Truliaboy”) who purchased a nice home via a short sale at 15% under the then current market value. It is a beautiful home on over an acre of land purchased for less than $300,000. With his permission I am posting this follow up story for the benefit of those who purchased “awesome deals” with little down, to show how one person was able to get rid of the Mortgage Insurance Premium via a refinance, and save a lot of money on interest as well, less than one year after his original purchase.

At time of purchase, the Annual Percentage Rate (including up front loan costs) on Truliaboy’s TIL (Federal Truth-In-Lending Disclosure Statement) was 5.336%. The recent refinance that closed last week carries an APR of 4.491%…a considerable savings. On the original 30 year loan, the Total Finance Charges for the life of the loan show as $260,169.12. On the recent refinance the new charges for the life of the loan show as $221,385.09.

Total Savings = $38,784.03.

Back to the issue of the Mortgage Insurance Premium. The Mortgage Insurance Premium on the original loan was $109 a month, and the loan amortization on the TIL included this amount for the first 9 years plus 5 months on a slightly decreasing scale. $109 a month in the first year and down to $93 a month in the final payments. By eliminating the monthly mortgage insurance premium, Truliaboy saved approximately $11,300 in monthly mortgage insurance premium payments.

His original monthly payment, including MIP, was $1,536.60. His new payment is $1,363.05. Total savings in his current monthly payment $173.55 per month.

1) If you purchased a house in the last year or two at significant savings by buying a short sale or a bank owned home with less than 20% down, you should look into the possibility of getting rid of your Mortgage Insurance Premium by refinancing your loan IF the current value is likely 20% less than your new Total Mortgage Amount.

2) Be sure to re-evaluate the Total Savings vs. the Total Cost of the New Loan AFTER the new appraisal comes in. It could cost you a few hundred dollars in “wasted” appraisal fee, but you need to be ready to pull the plug IF the new appraisal does not come in at an amount that will equal a new Loan to Value that is more favorable than your original loan. Make sure the monthly savings via reduced or eliminated Mortgage Insurance Premium (and interest savings if applicable) justify the cost of the refinance. Check your “comps” in advance as much as possible, to help determine the odds of a successful outcome.

3) Be sure to make as many LOW COST improvements to the home (if you have not already done so) to help insure a successful new appraised value. Clean and stage your home for the appraiser’s visit the same as you would for a potential homebuyer.

Part of the success lies in the fact that Truliaboy made some improvements to the home in the short time that he has owned it. The cost of the home’s improvements since time of purchase was approximately $10,000 to $12,000 BUT Truliaboy used his $8,000 First Time Homebuyer Tax Credit to make a huge dent in the cost of those improvements.

That is an AWESOME example of how to spend your $8,000 Tax Credit wisely, and parlay it into additional savings over the time you will be living in the home, by using the improved value to get rid of the PMI / MIP!!!

As in the original story, Truliaboy gets all of the credit from me for a job well done…AGAIN! Though Truliaboy continues to credit St. Joseph for his HUGE success story, I think it was a combination of factors, not the least of which was Truliaboy’s efforts that caused St. Joseph to bless him with this successful outcome.

If you were wise and lucky enough to purchase a home at considerably less than the appraised value at time of purchase in the last couple of “sub-prime crisis” years, and you bought the home with less than 20% down payment, be sure to look into the possibility of turning that “instant equity” into REAL today savings by eliminating the Mortgage Insurance Premium via a refinance.

FHA 30 day “public comment” period

For the next 30 days, HUD is seeking public comment on the following policy changes, each of which are designed to mitigate risk to the Mutual Mortgage Insurance Fund while promoting sustainable homeownership for FHA borrowers:

1) Update the combination of credit and down payment requirements for new borrowers. New borrowers seeking FHA-insured financing will be required to have a minimum FICO score of 580 to qualify for FHA’s flagship 3.5 percent down payment program. New borrowers with credit scores of less than a 580 will be required to make a cash investment of at least 10 percent. Borrowers with credit scores of less than 500 will no longer qualify for an FHA-insured mortgage.

2) Reduce allowable seller concessions from six to three percent. Allowing sellers to contribute up to six percent of the home’s sales price to offset a buyer’s costs exposes the FHA to excess risk by potentially driving up the cost of the home beyond its appraised value. Reducing seller concessions to three percent will bring FHA into conformity with industry standards.

3) Tighten underwriting standards for manually underwritten loans. When using compensating factors in the underwriting process, lenders will be required to consider those factors which are the best predictive indicators of loan performance, such as the borrower’s credit history, loan-to-value (LTV) percentage, debt-to income ratio, and cash reserves.

All of the above is a quote from the HUD.Gov site linked in the first sentence. Anyone who understands what these new measures will or will not do for the public at large should take a few moments to respond to the Government’s request for “public comment”. I know I will. This is a topic that not many fully understand, so it is very important for those who do to respond from the standpoint of “public good” vs self-interest.

This Week in Seattle Real Estate

Short Sales and Bank-Owned property as a percentage of the total market is a very important topic. One worthy of tracking on a week to week basis. There seems to be a false sense that these are “evenly distributed” throughout the County. Rather than get into a “yes they are; no they’re not” spitting match, let’s look at the actual data.

King County as a whole:
7-12 kc

In the graph above we see that 25% of all property sold in King County this week were “distressed” sales. For those who like the break down, 49 of those 94 were Bank-Owned properties and 45 were Short Sales. Not a significant imbalance one to the other. Not a significant difference in % of total sales on those that went Pending this week. I’m counting Pending Inspection and Pending since that will not duplicate the stats and will capture those that went straight to Pending with no inspection requested. That total is almost 24%…so not a big difference between closed sale data and pending sale data.

BUT when you look at some of the break-downs by area…HUGE DIFFERENCES!

7-12 sold

4 out of 6 of the closings in Auburn were distressed property, but only 1 of the 14 in Bellevue was distressed. 9 of the 14 sold in Renton were distressed property, but only 2 of the 12 in Redmond were distressed. Kirkland’s results are over-stated here and usually look more like Bellevue and Redmond’s numbers. You can see that in The Pending Sale Chart which for some reason would not post here, so I put it over on my blog.

I will try to run the stats every Monday so that we can combine them in 4 week comparison blocks. The results will vary somewhat from week to week, BUT some areas are clearly 50% or more distressed property, while others are only 10% to 15% distressed property. Looking at valuation factors for all of King County as a whole will not tell you enough. You could clearly be overpaying for a home in some areas, if you are using a County Wide % as to how much the market is up or down. There is a HUGE variance, as you can see in the graph here and the one over on my blog.

Again, apologies for not putting that 3rd and final graph down here and diverting you elsewhere to see it. When Dustin gets back from having fun, maybe he can figure out why it wouldn’t take.

(required disclosure – the stats in this post and graph were not compiled verified or posted by The Northwest Multiple Listing Service)