2018 Home Prices in Redmond 98053

Before the graphs, time to mention that there were 572 homes sold in Kirkland 98033 last year, 625 homes sold in Kirkland 98034, 620 homes sold in Redmond 98052 compared to 352 sold in 98053. The 2 active listings at $2.5M+ are extremely large land parcels with a home on each.


More Zip Codes to follow in subsequent posts. Some will be Eastside and some will be Seattle, but only in places where I work, so mostly North of Downtown in Seattle plus Shoreline, Kirkland-Bellevue-Redmond, Issaquah-Sammamish and bit of Bothell on The Eastside.

ARDELL DellaLoggia, Sound Realty – 206-910-1000 cell – ardelld@gmail.com email

Required Disclosure: Stats in this post are hand calculated by ARDELL in Real Time and not compiled, verified or published by The Northwest Multiple Listing Service.

Related Posts
2018 Home Prices in Kirkland 98033
2018 Home Prices in Kirkland 98034
2018 Home Prices in Redmond 98052

Selling a Kirkland Condo – Staging and Photos

condo windows

Whether I am helping a client sell a house or a condo, my thought process is generally the same.

Start at “buyer profiling”. Who is likely to buy this property? Then make a list of the top 3 to 5 reasons why THAT person, whom you have targeted as the likely buyer, will choose THIS property over others that are for sale.

The first part, “buyer profiling” is an old method I learned when I was a Certified Corporate Property Specialist for Coldwell Banker back in the 90s selling vacant properties where the owner was relocated for job reasons. There is less of an emotional pull from the owner, and the process is more of a business effort to sell, with little to no accommodations for the seller’s emotional “triggers”.

For this condo, which was sold about a month ago, I determined the individual would likely be a single professional person…or at least that would be the person who might pay the highest price for it. I also determined that the person (or possibly couple) would likely be younger vs older because there were a lot of steps up to the front door. Not likely an “empty nester”, as might be the case for a ground floor unit with no steps.

Next I listed the reasons why someone would choose THIS condo over the other 65 or so condos for sale in Kirkland at the time priced at $250,000 or less.

1) View of Lake Washington (only 6 of 65 have a view of Lake Washington)
2) 1,000+ square feet (only 11 of 65 are over 1,000 sf)
3) Super high ceilings on the inside interior walls of the main living space
4) Clerestory Windows at the top of the high ceilings
5) Travertine and “wood” floors vs carpet

It is very important that you match your staging and photos to the main selling features of the property. NICE is not good enough. This particular condo is a great example of that because the owner hired a professional stager and I had the photographer take photos…but…

I just wasn’t happy. I didn’t feel the property would sell at its highest possible price based on that in person and online presentation. It was nice, the photos were “good” and better than most if not ALL other properties for sale. But they just didn’t tell the STORY of THIS condo well.

condo before after 1

condo before after table

condo view from sink

Kirkland Condofull set of before photos and the full set of after photos click on those links from the photographers site at HD Estates.

I use Brooke at HD Estates for my listing photos, and it was funny that when she first came she knew immediately that I had not staged the condo. She had done several of my properties this year, all of which I had staged myself, and she just knew. The tired old floor lamp with the fern…the granny orange shaw vs the red throw…the weeds on the table vs the art deco glass bowl…even in the bedrooms and bathrooms she just knew something wasn’t quite right. 🙂

I’m glad I went to the extra time, trouble and cost. The owner paid $92,700 for this condo just two years ago and we were able to sell it in less than a week with five offers at $233,000 with no home inspection contingency and no must appraise clause.

Might that same result have happened if I did not re-stage it myself and have the photos redone? I don’t really know for sure. What do you think?

Home Prices in Redmond Washington

I was running some stats the other day for Kirkland, Bellevue and Redmond home prices and the graph below came out a bit oddly, as if all prices are trending to 200 to 207 per square foot. I say “oddly” because some went UP to there while others went DOWN to there.

That is not to say that median home price within these various Elementary School boundaries of Rockwell, Mann, Einstein, Alcott and Audubon are all running together. In fact there is quite a variance as shown in the graph below.

As noted in my original post the numbers are graphed from low to high in this manner vs to start from zero…which would show the flatter market consequence, would not permit you to see the actual numbers one on top of the other, so I caused them to spread more dramatically only for the ease of reading the underlying data detail.

Rockwell Elementary…very consistent as would be expected given its “close in” location to Redmond Town Center and the general lack of new construction of single family homes within its borders.

Mann elementary still one of the best “bargain” areas relatively speaking and when lucky enough to find a good house there like the one my clients purchased between 2 and 3 years ago, within the timeframe of the charts, Mann continues to be one of the best places to get a home at a fair price that is not too far out.

Einstein…well the fluctuation there is greater for a few reasons some of which have to do with the school and some of which has to do with the decline from “new” to “used” and the turnover of homes too quickly back 2 or 3 years ago causing the dip. But looks like it is recovering nicely from all that.

Alcott and Audubon tell the story of people being willing to go a bit further out to get a newerish house, as in not built in the 60s or 70s, with a large yard at a reasonable price. Clearly 98053 and Sammamish have both been the surprise change in market conditions in 2012. Even though “close in” is still preferred, the willingness to go out further for good house and great school like this one my client’s purchased this year with more land than being closer in was definitely a game changer in 2012 for Redmond.
********
Required Disclosure – Stats in the post and the charts and graphs herein are not compiled, verified or published by The Northwest Multiple Listing Service.

On a cumulative and median basis, prices are trending slightly up in the 3% to 6% range. But that is not to suggest that buyers need to panic, or sellers should be getting overly optimistic, as to potential sold prices.

2012 Median Home Prices UP…and DOWN

Single Family Median Home Prices are UP 6% YOY for the First Half of 2012 in Seattle.

First Half 2011 @ $399,000 – First Half 2012 @ $423,000

Bellevue School District is the Big Winner at UP 20% with a Median Home Price of $689,000.

Issaquah School District DOWN 4%, Northshore School District DOWN 2%

Lake Washington School District UP 4%

Median Home Prices for First Half of 2012:

Bellevue School District: $689,000

Issaquah School District: $521,000

Lake Washington School District: $498,000

Northshore School District: $376,000

Seattle School District: $423,000

Northshore School District has become a pretty good buy lately, given many of the schools have shot UP in the rankings and the median Home Price is by the far the lowest in the mix.

********

Required Disclosure: Stats are not Compiled, Published, Verified or Posted by The Northwest Multiple Listing Service.

********

ARDELL 206-910-1000   ardelld@gmail.com   ARDELL DellaLoggia, Managing Broker, SOUND REALTY

Buying New Construction – Choosing the Lot

The first step in buying a new construction home, unless it is an already built “spec” home, is to choose the lot. However, not all lots can hold all homes. So to some extent you have to choose both the home to be built and the lot at the same time.

Let’s look at a small subsection of a fairly standard looking new construction development as to variations of lots available.

ncsp-001

Choosing the lot is likely the most critical phase of buying a new construction home that is not a spec home. It used to be a lot easier to pick the best lot…or at least a good one. A standard lot was built into the price of the home and there was a “lot premium” for the other lots. Let’s say the lot premiums ranged from $2,000 to $15,000. That gave you a gauge as to how much better than a standard lot, the lot you were selecting was.

Unfortunately those days are gone and most salespeople will tell you they are all “best” lots.

Looking at lots 1,2,3 and 4, lot 4 would usually have a premium as it sides to an “open space”. You might say the same for the corner Lot 1. But if the street to the left of Lot 1 is a very busy road…now it is a lesser lot without benefit of no neighbor to the left. In essence your “neighbor to the left” is a bunch of dirty, noisy traffic. Some people feel the same way about the drainage basin to the right if it is ugly and attracts mosquitos. Sometimes people think the drainage area is going to look like a “pond” the way it states on the site plan…and sometimes it does. But more often it looks like an unkempt ugly drainage pool.

Trees? Good Drainage Issues? Can you see a green, yellow, red blinking street light from your master bedroom window? All too often someone picks the lot without standing on the lot…bring a ladder. Stand higher. 🙂

Choose the best lot and the worst lot and assign values from there. Don’t do this from a site plan like the one above without walking the entire area to see what is on the outside of those perimeters. Will there be more new homes to the North or are there existing run down homes with a few junkyard dogs.

You have to get very close to picturing the home on this lot the same way you would if you were buying an existing home on that lot. This is VERY difficult for most people.

Generally speaking only people who buy the BEST lots choose the lot and build from scratch. It makes little or no sense to build a home on a substandard lot vs waiting to see what the home looks like on that lot.

So if all of the best lots are gone…you are often better off buying a spec home or a newer resale home, than building on a substandard lot with no recourse to not “like” it once the home is put on it.

New Construction is not for everyone. If you can get the biggest and best lot in the neighborhood…go for it! The end result can be very rewarding.

Warning: School Rankings Just Went Whacko!

schoolMany parents or “to be” parents use School Rankings as part of their Home Search Process, and I generally support that wholeheartedly. BUT something is amiss!

I don’t know what just happened. Possibly a new set of test scores just came out? The lineup of schools on most School Rating sites just shifted, and the results are staggeringly “off”. One is always forewarned about using these sites as indicators of a school’s net worth, or an indication that your child will get a better education. But usually they follow the sequence from high to low that blends with the overall frame work of areas and home prices and long term supports for what I call “the lineup” of “Best Schools”.

But for some reason, one of the long term lowest ranked schools just jumped up to highest. Usually the top 1 to 5 schools stay in “a pack” and move around. One year one is “the top school” and then it moves to 2nd place. 3rd can jump to first…and so on.

The 10th ranked school RARELY jumps from tenth to first overnight! I’ve never seen that happen before, and I am seeing it happen today. It could have happened in the last week or so. I don’t check them every day.

Be forewarned…something is amiss. I can’t put my finger on exactly what caused this recent change, and it is fairly overall across different schools and different ranking sites. Just be forewarned that if these sites were ever reliable and/or you have considered them to be so, and I generally have over the years, there is something rotten in Denmark at the moment.

I strongly suggest you not use them in your home search process until we can figure out what the heck just happened.

Is King County at 2001 or 2005 price levels?

Was reading the questions in the comments over on The_Tim’s post about “The Bottom Falling Out on the Low Tier”. That prompted me to run some numbers on two cities in King County. One of which is moving more solidly back into the low tier…and quickly. Another that has been in the high tier since before prices started increasing dramatically in the credit boom years.

Before I post the data, I think we should strike the tiers of 2001 and 2011 based on all Single Family Home sales in King County only, since Case-Shiller tiers are based on a different set of criteria. For this purpose I remove single and double wides, houseboats and townhomes and deal only with detached single family homes. I am using the first 5,000- homes sold in each of those years to set the tier values, since my home calculator stops at 5,000 homes. For 2001 that is the 1st quarter sales. For 2011 that is through the end of April.

2001

Low Tier – < $216,000
Mid Tier – $217,000 – $310,000
High Tier – $311,000+

with median of high tier at $400,000

2011

Low Tier – < $274,000
Mid Tier – $274,000 – $447,000
High Tier – $447,000+

with median of high tier at $614,000

For those wondering why these Tier Pricings are so very different from Case-Shiller numbers, it’s because Case-Shiller combines King, Pierce and Snohomish Counties. These are for King County only. ALSO, I’m pretty sure Case-Shiller uses resale (matched pairs) and pretty much excludes New Construction entirely, and a lot of Redmond’s story and the high price tier story is in that New Construction.

The dramatic change in the median price of the high tier tells us A LOT!

Obviously based on median prices, King County is no where near 2001 levels, BUT the following data is a bit startling.

graph (16)

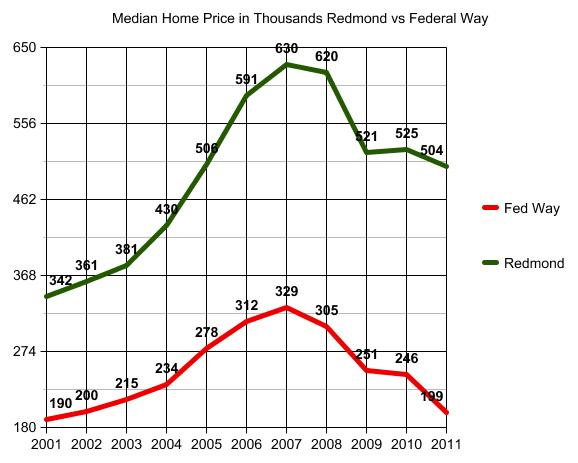
Redmond running a hair under 2005 median home price, but no where near 2004 median pricing. Federal Way on the other hand quickly degenerating toward 2001-2002 pricing.

Of course once you have some more information…you have to keep going to determine the why of it. “Why” never has ONE standout answer…but the mix of foreclosures is clearly a BIG part of the story.

2011 fwr

I remember reading a question on a general forum asking why a person can’t find a foreclosure home to buy in their area of preference, when all the news stories are pointing to the DELUGE of foreclosures? Well, ZOMG! that snapshot of the market above “tells a story…don’t it?” to quote Rod Stewart.

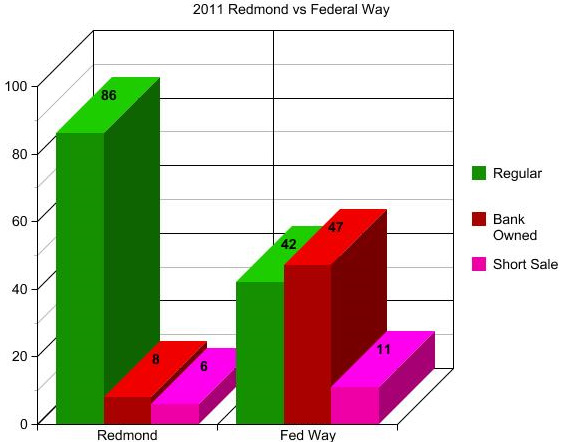
Now compare that to 2010 and you will quickly see why the Bottom Tier is pulling away…and getting HAMMERED!

2010fwr

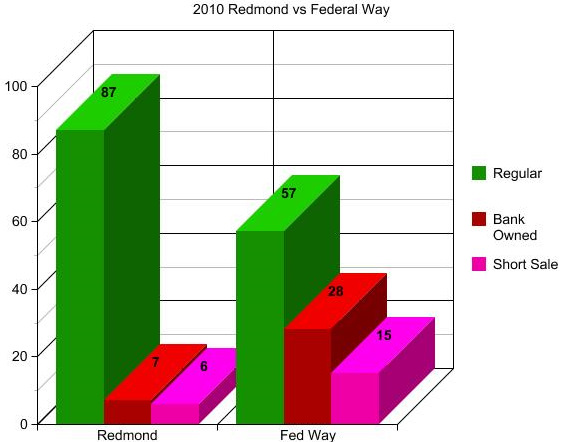
The % of Foreclosures and Pre-Foreclosures (short-sales) in Redmond has barely changed. Federal Way? Well…maybe they have no place to go but up? Certainly hope so.

Now let’s look at the HUGE decline in Price of Bank Owned Property 2010 to 2011. This is going to knock your socks off.

Sorry…have to throw this in as a link over. The chart won’t load.

The short of it for people who don’t like to click on links is that the Bank Owned Solds in Federal Way not only jumped UP from 28% of total sales to 47% of total sales, but the median price of those Bank Owned sales declined from $191,000 to $156,000. WAY below 2001 pricing, and with the volume of them, they dragged the median overall sold price down from $246,000 in 2010 to $199,000 YTD 2011. Maybe it will swing back a bit by year end. But Holy Caboley!

As you will also see in that link, Redmond Bank Owned solds did not change much at all as a % of total sales, BUT the median price of those dropped from $475,000 to $330,000. Still…not enough of them to impact the overall median sold price much in Redmond.

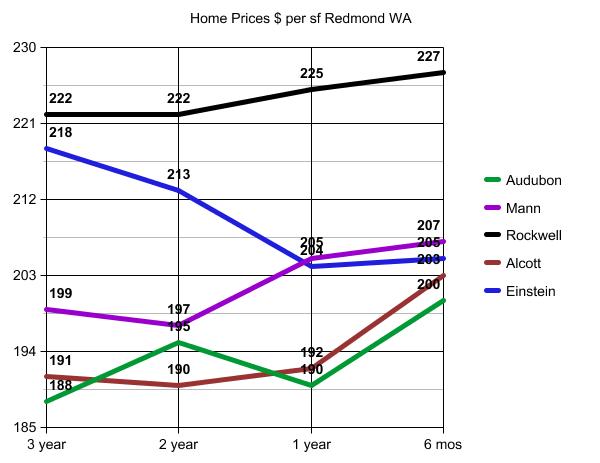
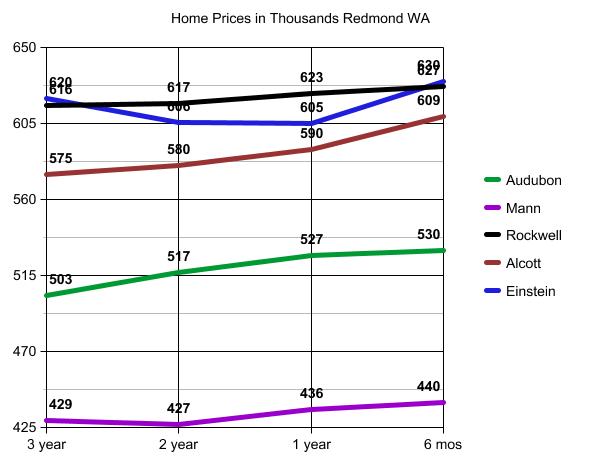
Redmond is easier for me to explain, since I don’t work in Federal Way. Let’s see if I can get another graph to load up. WordPress is liking graphs better than Raw Data Charts.

age

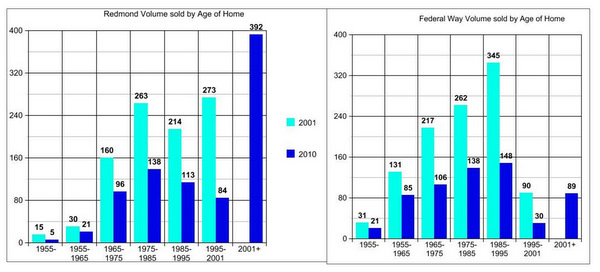
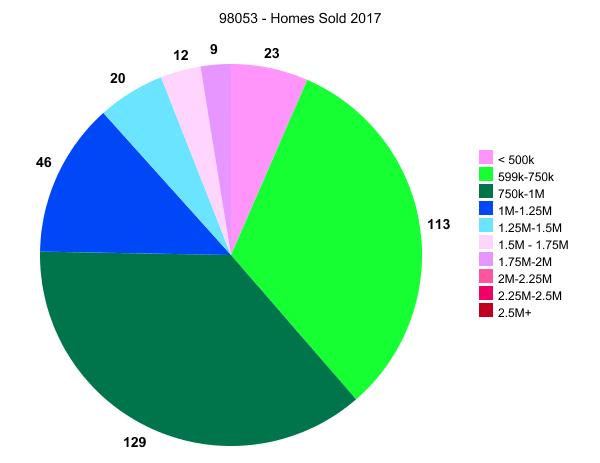
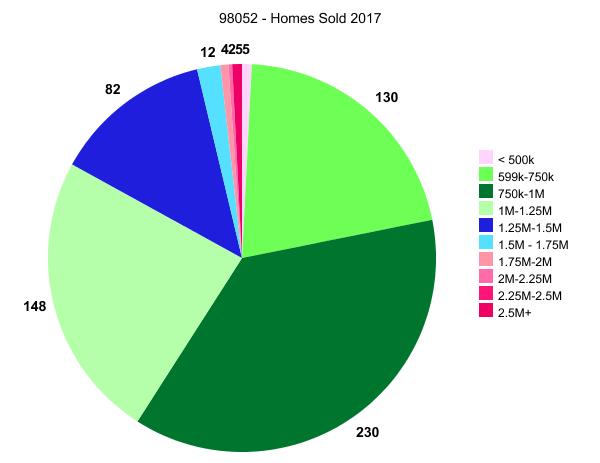
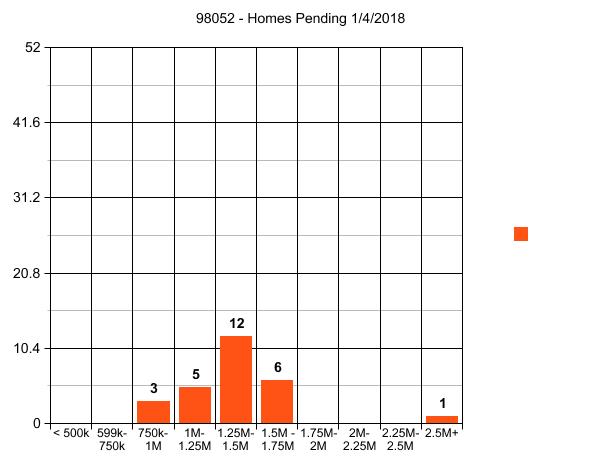
I combined these two so you can see the dramatic difference. Homes Sales in Redmond are being bolstered by the fact that a LOT of new and newer homes are being sold. You may see that change dramatically in 2012 as the builders seem to be shifting over to Sammamish due to the fact that they have used up a lot of the available land in Redmond.

To some extent the shift will move from 98052 to 98053, 98074 and 98075. But will the buyers shift with them? Probably yes, unless there are a lot more newer homes on resale in 98052 to compete with the travelling builders. You may say there are still plenty of newer resale homes in 98052, but track that against school rankings, and you will see what is happening there with regard to Elementary Schools.

So the drastic decline in Redmond Bank Owned Sold Price from 2010 to 2011 has a lot to do with the % of homes that are, or more aptly said WERE, newer homes. It looks like the glut of spec home leftovers here and there were pretty much sucked up in 2010 when 80% of the Bank Owned Sales were NEW…built since 2005…and most never lived in. Those empty new homes, some completely finished…some not so much especially as to landscaping, are pretty much gone.

Scanning at my notes here (my desk looks like the whacky professor after doing all of these stats on scribbles before processing them into charts and graphs) I’m seeing that the total # of foreclosed properties in Redmond 2011 that were built prior to 1980 are equal to the total # of foreclosures in 2010 of which 80% were built after 2005.

So the decline in price of foreclosed homes in Redmond (as noted in the link above) has more to do with the AGE of those homes, than a drop in prices.

Why the big drop in price in Federal Way? Age of homes does not seem to account for that. I don’t work in Federal Way…so it’s not as easy for me to read reality into the data there, as it is for me in Redmond. My best guess is that it is a degenerating market…like a cancer growing…each new set of foreclosures running off a discount of the current median price. Each new wave of foreclosures dragging that median price down due to sheer volume…and the downward spiral is feeding on itself.

Will be interesting to see if any of this swings back into place by year end. My gut tells me 2012 is going to be a wild ride. Looks like Federal Way has no place to go but up, let’s hope so.

Redmond on the other hand is likely going to lose a lot of that huge support from the new construction homes over to Sammamish, unless we start seeing a whole lot more newer home resales coming on market. That may also be good news for people in Redmond who have been trying to sell their built prior to 2000 homes. I have a feeling it will.

I just don’t see all of the Redmond buyers running over to 98074. Some, yes. Relocation Buyers, yes. But for the most part, either sales volume is going to plummet…or people are going to starting getting a whole lot more interested in some of those older homes that have been languishing on market during the new construction surge up on Education Hill. Probably a little of each.

More graphs and data on the above HERE, HERE and HERE. The last one helps you track the median price for these two cities in each year since 2001, so you can see the rise and fall to and from peak.

(Required Disclosure – Stats in this post and it’s graphs and charts are not compiled, verified or published by The Northwest Multiple Listing Service.)

Should you buy a New home or an Old one?

Education Hill RedmondLots of people want a NEW Construction home, the same way they want a new car vs a used car. However starting the home buying process at “I want NEW” is just as wrong as starting the home buying process at “I want a foreclosure”.

As I have said many times, in my experience more people HATE their “home”, and want to move to a different one, because of WHERE it is vs WHAT it is.

“…and underneath all is the land…” and land is a limited commodity. So where is that NEW home going to be built? Maybe…just maybe…on the wrong piece of land. The lot no one built on prior to 2011…for good reason. Even NEW(er) home will raise this issue. So if you have your heart set on a NEW home…the number one question you need to ask is:

WHY DIDN’T ANYONE BUILD A HOUSE ON THIS PIECE OF LAND BEFORE TODAY?

So many people limit their looking to the obvious and the house itself. If you are looking at new or newer construction…begin your investigations at the land that home is sitting on. Looked at one yesterday…without going to it…via Google Maps and the Stormwater Management Comprehensive Plan for that area, and the house was built on a lot IN “The Wetlands”.

Think about that for a minute. What are the various reasons a lot might be available for someone to build homes on today…that is close in to work and good schools and shopping? It’s common sense really. Especially today…after a huge building surge from 2004 to 2008…was there really a piece of land the builders didn’t find and build on during that time? Yes…a few…but not many.

IF wanting a NEW house is your goalyou would be wise to first examine the land of it…and why no one built on it before (unless it is a tear-down lot). Oddly, the one I checked that was “in the wetlands”, well…really, you have to ask yourself. How DID it get built there? Basically one is not allowed to build a house in Wetlands. Why does it not require flood insurance with drainage basins to the north, east AND south of the house?

Think you can “see” all that? Well what about too close to underground gas pipelines? Can’t see that.

My point is you are better off listing all the things you want from a neighborhood, a location and a home, without regard to AGE of home. Then…if none that have the best location are new…well, maybe NEW Construction should not be the FIRST item on your “wish list”.

Prioritize that wish list by the where…before the what in that where. It’s common sense really, isn’t it?

If it has been a Best Place to Live for 10 to 100 years…it was likely built on before yesterday.

Seattle Eastside Housing – Buy or Wait?

Seattle Eastside Housing – Buy or Wait? is a Google Query that directed someone from Bellevue over to my blog about ten minutes ago, looking for an answer to that question.

Often people get confused by the big price tags and unfamiliarity of housing, so let’s use a simple every day analogy to explore “buy or wait”. The other day I decided I had nothing to wear. I don’t know how that happens all of a sudden…usually it’s because I gained weight. First the answer to “Should I buy now or wait?” in that scenario is you wait thinking you can lose that extra weight. Then one day you just say…this isn’t working…I need to go buy some bigger clothes.

Often people need to buy a house because they have “outgrown” their current home the same way that I outgrow my clothes. Every day that you live with something substandard to your needs, is really a day wasted, isn’t it? If you are having another child, and you are uncomfortable with the size of where you live without that new person…well, you can’t wait until the child is born and moves out really. So it’s time to go look for that bigger place. Not necessarily buy it…but yes, time to go looking for something you may buy.

I use having a child as an analogy, and it is very common for people to need a bigger place because the woman is with child, or because a couple decides it’s time to start having children. But the need for a bigger place can be because of other every day needs that just don’t fit where you are.

If you already own a home, waiting is almost never the answer. The value of what you have will often move to the same degree as what you are going to buy. If prices go down 5% in the interim and you own a $450,000 home and plan to buy a $600,000 home, you will lose $22,500 while waiting to save $30,000. For the move up buyer, waiting is almost never the answer unless the family is willing to sell…rent…wait…then buy, which is not the usual scenario. Happens…but not often. Usually because what is available to rent is substandard to what they already have…so they might as well bite the bullet…or wait. The extra move in between is rarely worth it. Sometimes…yes. Often…no.

The decision for the First Time Buyer is not as difficult as people may think. One of my favorite lines from my son-in-law Mike is “Mom, if THIS is what I can afford to buy…I’d rather rent for the rest of my life.” Gotta love that Mike. Straight forward, common sense decision.

The first stage of “Buy or Wait?” is to go find out what you CAN buy for what you can afford…THEN…take a step back and say “should I buy or wait?”

I’m revisiting a decision of one of my clients from 18 months ago. I know there are many news stories saying prices have changed a lot since my bottom call of February 2009…but really, that’s not the case. Not for good homes in prime neighborhoods on The Eastside. Maybe not at all, given Aubrey Cohen’s most recent article, the title of which is pretty much a direct quote from his article on me in early 2009. So it apparently still applies today.

Back to my clients who first approached me…sorting back through 260 emails to find the first one…here it is:

3/18/2010″ “My wife and I are looking at purchasing our first house, and we’d like you to be our agent…do you think now would be a reasonable time for us to buy? I saw in your latest post that you expect the prices to drop. How much do you expect them to drop? ”

Given I don’t think this year is really any different than last year, let’s check that against reality.

1) We looked at houses priced at around $450,000. There were a few that “would do”…but based on those particular houses, I saw no reason to buy now vs wait, unless they were willing to consider as far out as Issaquah vs Kirkland, Redmond or Bellevue near Microsoft.

We looked at homes for as long as it took to gather enough information to answer the question “Buy or Wait?” That takes shorter or longer for different people…and is largely dependent on the available inventory during the period of time.

2) On 4/23/2010 We had a breakfast meeting at the Brown Bag. Basically we looked at all of the options for about 30 days and then had a “Buy or Wait” meeting. One thing about real estate that people often miss as to Why You May Need An Agent is the perspective of my TWO clients was not the same. I remember the wife…due to have her baby in July…saying ideally she would like to be in a home by June. The husband finished her sentence with “…or July, or August…or next year…”

3) Given the husband and wife were not necessarily in total agreement there, not arguing…but not necessarily “on the same page” either, I asked to visit them where they were currently living. I don’t often do that when someone is in a rental…but I needed to test “by June” against “…or July, or August…or next year…”.

When I visited them in their small apartment and they showed me the dresser drawer where the baby would go IF they Waited…vs Buying now…the answer to “Buy or Wait” became CRYSTAL CLEAR!

So with renewed motivation and a price of $550,000 vs $450,000 we found “the home” for them to buy and made the offer on 4/26…only THREE DAYS from our “Buy or Wait” meeting. They closed on 6/10 as it was a somewhat difficult Bank Owned property.

Now…let’s revisit my client’s Buy or Wait decision and second guess it based on what has happened since.

They paid $550,000, 1.1 X Assessed Value (a green price in a blue area). They paid $215 per square foot. Now let’s look at what has sold there since they purchased a little over a year ago.

First, the other one on market at the time they purchased: Closed 5/29/2010 – just before their closing – sold for $587,000 – just over their max of $550,000. Multiple offers…they couldn’t make an offer on it due to price. It was assessed for slightly less (only $4,000) was smaller at 2,460 sf vs 2,550 sf. So even though the bank owned sale was troublesome…worth the effort. Not a huge savings…no “deep” discount for the bank owned home they purchased…but enough of a discount to make it a good “Buy Now vs Wait” option for them.

Recent Sale in Same Neighborhood: Sold in 9 days for $602,000 on June 8,2011 – assessed for $8,000 less than the one my clients bought last year – Sold for $244 per square foot vs the $215 per square foot my clients paid last year. It didn’t have anything better than the one my clients bought. It needs a new roof, does not have granite counters, needs the carpet replaced with hardwood floors in the living room and dining room…nothing more for that $244 per square foot vs the $215 per square foot my clients paid in June of 2010.

One house did recently sell for $540,000…but it backed up to Avondale Road…so…the relationship to assessed value and price per square foot is a non-issue, given backing up to Avondale Road is not “a comp”. Given they paid only $10,000 more for a house last year that is NOT backing up to Avondale Road…I’d say the Buy vs Wait decision has withstood the test of time.

One might say they could have waited 3 years or 5 years…well, we’ll look back on that in 3 years or 5 years…but the reality for most people is “Buy vs Wait” is usually a question with a max timeframe of a year to 18 months…not wait for 3 to 5 years.

Buy now or wait until next year…in Jan of 2008 = wait until next year. But since Feb of 2009…wait is not likely the answer…but buy WHAT is a huge question? Follow the process I have outlined in my 1), 2) & 3) up there…and you will find your best answer to that question for your family.