1) Make a “value grid” of the area you are interested in.
2) Overlay an Elementary School ranking grid (whether or not you care about schools).
3) Use steps 1 and 2 to define your “target area” and make a new chart highlighting Market Value’s relationship to Assessed Value in that smaller, defined area.
Before I demonstrate how to apply these techniques, some insight on why I am writing this post today. It is in response to a few comments I read in The Wall Street Journal’s article on Buyer frustration, namely:
“The mood among buyers was ‘nasty’…customers just keep getting outbid on the houses they want.” Glenn Kelman, CEO Redfin
“What’s selling is the Cream of the Crop, and they sell fast. What isn’t The Cream of the Crop is getting hammered.” Real Estate Agent in Florida
“It’s a false buyers market. If you think prices are cheap, wait until you start making offers.” 32 year old home buyer
The main reason you want to start your home search on the internet, is to formulate some strong opinions about what you DON’T want, especially with regard to over-paying for a home, before you step into the arena.
The tug of war in the Internet Home Game is that agents want you to just come OUT and SEE the house, hoping you will fall in love with the house, and not care so much about it being a “good value”. The homebuyer is refusing to GO SEE the houses that indeed might create this scenario, which will work out better and best for the agents and sellers than for the home buyer.
The Mexican Standoff is created by sellers pricing based on their house being somplace where it is NOT, and buyers making offers based on some overall market statistic that may or may not apply to the WHERE they want to live.
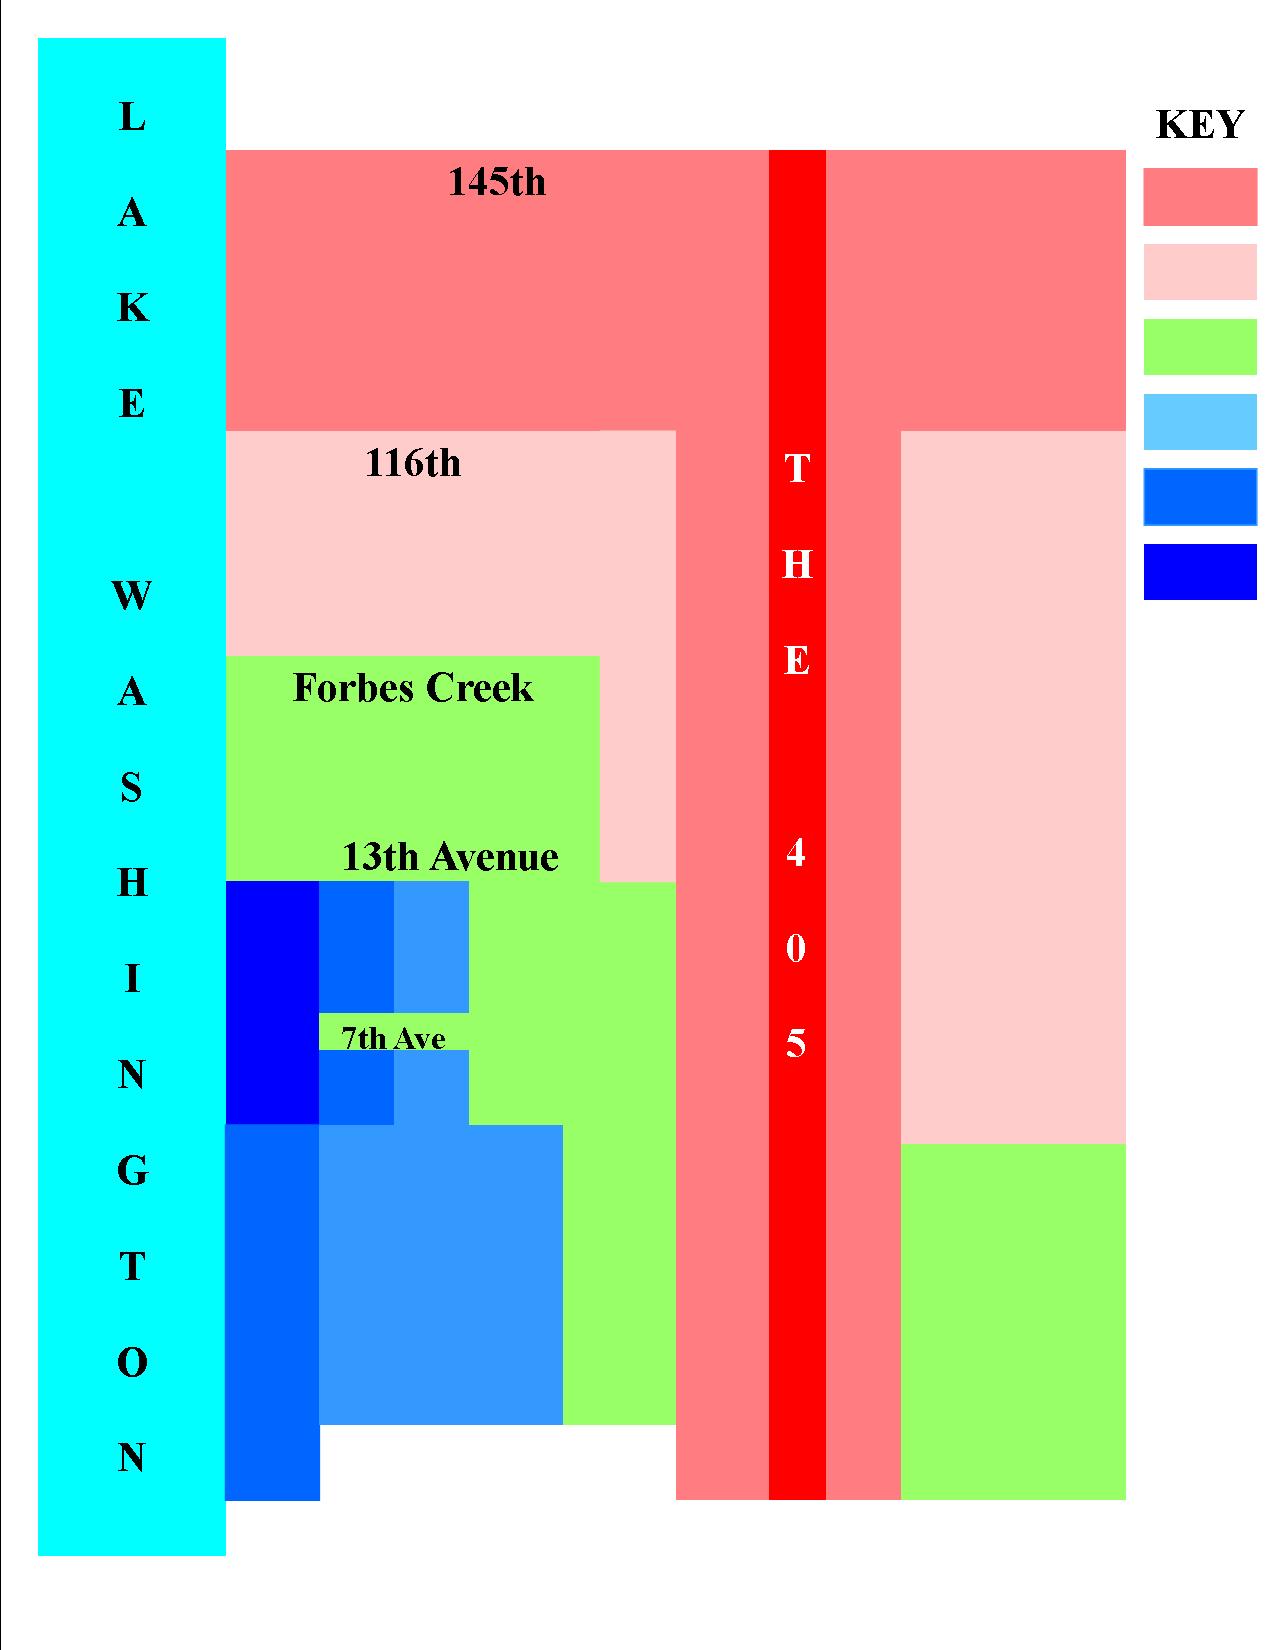
To demonstrate this technique I am using the City of Kirkland in the example, because it is one of the easiest to break down into its value segments.
VIP! EVERY area has these VALUE TIERS with sellers in the dark pink area trying to price like the light pink area and sellers in the light blue area trying to price in the dark blue area.
That is what “over-priced” means, to a large degree.
WARNING: Some severe Real Estate Transparency ahead. Agents generally do not convey this information publicly because it can be offensive to buyers and sellers in the lesser value tiers. While all good agents use these methods with their clients, there is good reason why they do not speak of these things publicly.
If you are a homeseller or agent who wants to pretend that the only factors are school DISTRICT and those that relate to the home itself, this is not a good post for you to be reading.
1) A “VALUE GRID” example
TO UNDERSTAND AND CREATE A VALUE GRID, YOU HAVE TO UNDERSTAND WHAT THOSE VALUES ARE PULLING TOWARD AND AWAY FROM.
This is likely the main argument for why you need “a good agent” unless you can use these techniques to represent yourself. This is why having “any” agent is not necessarily better than representing yourself. When I ask an agent what “his service area is” and he says “ANYWHERE!”, I know he is not a “good” agent.
It is great to keep up on general market conditions, using sites like Seattle Bubble that tend to speak in terms of COUNTY stats. I read it all the time. BUT if you don’t take all that a step further into your area of interest, you will be the poor schnook who bought the house in the green section at a medium blue price and ended up selling it at a light pink price.
That is something that you need to understand about FORECLOSURES and why agents pay less attention to them being a “market value” setter. Sure, if someone buys a house in the green section and prices it at time of sale in the green range of value and it ends up in foreclosure, we all sit up and take notice! BUT, but, BUT when we see the house that sold for a medium blue price in the green section come back as a foreclosure…we say…”poor schnook, who the heck represented him when he purchased THAT!”
That’s how an agent can sometimes tell that a house is overpriced before seeing the house. That is why you need to know that too…so that you don’t fall in love with it and start ignoring “the obvious” from an emotional standpoint. The same holds true for the opposite, however. MANY BUYERS ARE FRUSTRATED because they keep making pink offers in the blue area…unsuccessfully. To go back on the quotes from The Wall Street Journal article, the “Cream of the Crop” is BLUE in all of its 3 shades and then Green. Getting “hammered” are the greens who bought at blue prices or the pinks who bought at green prices.
This applies to New Construction Foreclosures as well, and the builders who got the land in the green sections, but penciled their profit numbers out on the blue ones, or who bought in medium blue thinking they could get dark blue prices.
A few notes on the Sample Value Grid. I don’t want to get bogged down in the detail of “Kirkland”, but to help you use this principle elsewhere, worth a little more comment. The dark blue section is basically a condensed form of West of Market. Once you know this, you will understand why a lot of the bargains are up at 18th Ave to 20th Ave, especially on the West side of Market Street. The Medium Blue section to the right of the dark blue section is the other side of Market Street known as “The View Corridor” of East of Market which runs from 1st STREET to 3rd STREET (but not ON 3rd) and from Central to 13th Ave. The lighter blue section to the right of The View Corridor is East of Market up to 6th Street (but not ON 6th Street). The green section to the right of that is called “the wrong side of 6th” and can turn pink and green alternately depending on which street. Lots of “bad” decisions on highest priced homes “on the wrong side of 6th”. Same holds true in the lower sections where 6th Street turns into 108th Ave NE. You have to balance the COLOR grids (and school grid) with the “freeway noise” in some of these areas on the southern portion of the grid in the blue and green areas.
The lines are not hard and fast, but understanding some basic valuation principles will help you understand “value” better and well enough to “bend” the lines when appropriate.
AGAIN…EVERY AREA HAS THESE COLOR GRID FACTORS!. They just differ as to where and why in each area.
********
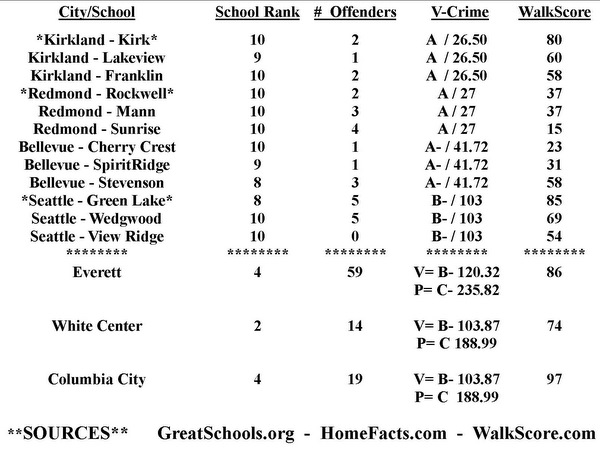
2) Overlay the ELEMENTARY SCHOOL GRID
This is a newer value increaser/inhibitor somewhat created by sites like GreatSchools.org and sites like Redfin using those rankings on its property detail pages down near the bottom. People always had a word of mouth “best schools” impact on home values and rankings of School District and High Schools. But the valuation demarcations based on ELEMENTARY school and the exact “borders” of those schools, is a relatively new phenomenon created by more information being available on the internet.
Knowing the school boundaries is great! But are we giving too much credence to sites like GreatSchools.org and SchoolDigger.com? Most real estate industry personnel say yes, and do not lend their seal of approval to these sites as readily as some newcomers to the industry. That said…there is some overlap between the school rankings and the traditional value segments. Most BLUE areas happen to have good schools. Some pink areas do as well. So to do our overlay, we don’t have to decide whether or not the school rankings are 100% accurate any more than we have to decide if green is better than blue.
Remember, if you can’t afford blue…green may be your best option and if you can’t afford green, pink in the best school may be your best option. OR pink with a great school might be better than green with a lesser school. OR…as pink gets darker toward another school district…a better school in the OTHER school district may be a better choice. These are the kind of things you need to consider when choosing an agent or choosing to represent yourself. Recognize these factors as “real” and learn from where the foreclosures exist and why those foreclosures happened.
That’s why you have to know why these areas are “colored” as such, and what they draw their value from. The upper pink section on the left is pulling from Bothell and Northshore School District vs Lake Washington (the lake itself) and Downtown Kirkland, as example. You might want to step over that line…or not.
If you take The School Boundary Map and overlay it on the VALUE GRID you will not be surprised to see the Dark Blue area serviced by a highest ranked school and the lowest ranked school planted firmly in Pink.
Life is not quite that simple and I’m not going to go there with you in this public forum. I give you the tools, you being a “reader” vs “my client”. There are limits to how much credibility I will lend to these ranking sites as a professional, and those limits are only shared with my clients. But hopefully, no matter where you are looking to buy, this shows why EVEN IF YOU DON’T CARE ABOUT SCHOOLS, you should not overlook the secondary value pressure of which elementary school is servicing the home you choose.
********
3) Market Value’s Relationship to Assessed Value in the “target market”
This is a little harder as you have to balance some other factors like land value, main floor footprint and home style. It looks something like the chart in the link just below this sentence, that I have used in posts before:
Market Value vs Tax Assessed Value
For a “target area” we will be blending steps 1 and 2 with this 3rd step, using the same color key as in the link above from green to red, which is different from Step #1 and it’s color codings. In this final step, lighter green is best (vs blue), but red is almost always a “stop sign” of some kind. 🙂
I’m going to lose a few more people here, but for those who are seriously needing to understand value of homes in order to pick one and make an offer…try to stay with me here. Be sure to click on that blue link just above marked “Market Value vs Tax Assessed Value” before moving on to the charts below.

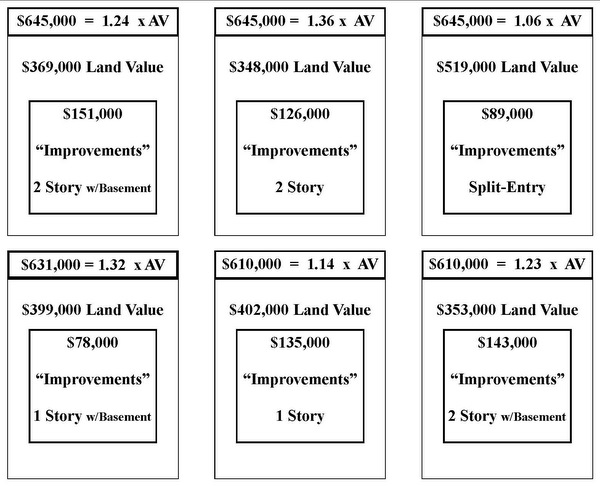
The BLUE background chart relates to point #1 and is a “Blue Value Grid Area”. In a Blue Value Grid Area, your best hope may be a Blue Price as noted in the KEY to the right, that being 1.2ish times Assessed Value. A few may even sell at the RED “bubble prices” if they are near water, have water views AND have been fully remodeled. You might find a green or two, but they will likely be “tear downs” selling at lot value.
If you are making Green offers in the Blue Zone….you may never achieve success UNLESS when you draw YOUR target MV vs TA map, there are some green sales.
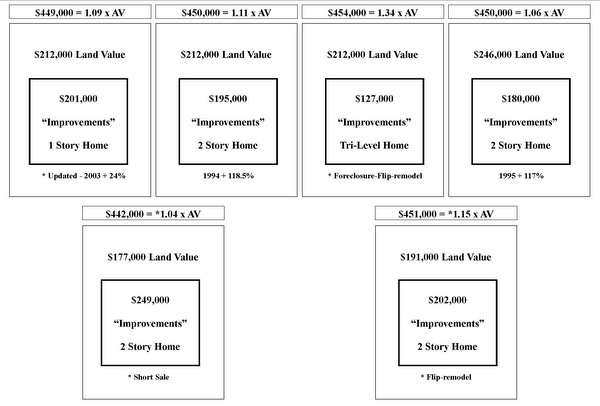
The PINK background chart at the bottom also relates to point #1, but most of the sales ARE green and none are red. In this area you DO NOT want to buy in the purple or above zone without VERY good reason.
I’ll try to simplify this. Let’s say most houses assessed at $800,000 sell for $950,000 in the Blue Zone. NONE have sold for less than assessed value except for the tear downs, or busy road, or malfunction of floorplan issues. That means if you keep looking for a GREAT house with no negatives and making offers of less than Assessed Value, then you are going to get frustrated.
BUT if you are in the Pink Zone where homes sell fairly regularly at assessed value or less (you need to do the actual stats to know if that is the case, this is just an example of HOW to do that) then you don’t want to be paying 1.2 or more times assessed value or $470,000 for a home assessed at $390,000.
EACH AREA will have it’s own relationship to Tax Assessed Value. This has ALWAYS been true in the Seattle Area and is a much better valuation tool than Price Per Square Foot, especially in areas with basements.
You need to calculate if your area of interest is a .97 of assessed value area, a 1.13 times assessed value area or a 1.25 times assessed value area. NO “area” will be a 1.5 times assessed value area right now…but a given house may be.
I’m going to stop here as I’m sure I’ve lost quite a few people by now. But THIS is roughly how good agents “work”. They don’t necessarily make little maps that look like alien solar systems as I have here. But this is an attempt to convey to you the process of how an agent generally values homes and the property they sit on.
Feel free to expound on the topic by asking specific questions in the comments. I’ll do the best I can to explain further in direct answer to those questions.


 It’s “YAY DAY” over at Seattle Bubble today, as “The Tim” reveals to his readership that now was HIS “time to buy”, for his own good reasons.
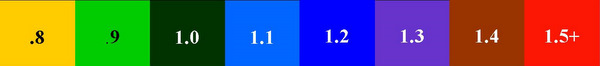