Seattle Ain’t What It Used To Be – Home Stats

In 2004 over 17,000 Residential Properties sold for $400,000 or less In Seattle. Now…less than 1,300.
In King County the number dropped from over 30,000 to a little over 8,000.

In 2004 only 333 houses sold for more than $900,000 in Seattle. Now…over 2,600.
In King County the number increased from 1,050ish to almost 7,400.

It’s not merely about median price increases. It’s about the displacement of people who are making the median income or less being replaced with a whole different income class.

Here’s a visual.

I was running stats for a different reason. Given the recent change/slump that has been broadly recognized both here and in many places around the Country, it’s a good time to take stock of where we are and where we are going and to some extent…where we need to be going.

Below is an almost complete visual of all of the stats I was running for King County, Seattle and The Eastside. I used “Kirkland, Bellevue and Redmond” as a brief snapshot of “The Eastside”. Looking at the data is like looking at clouds. Everyone sees something a little different. But for me the top photo snapshot is pretty jaw dropping.

It pretty much explains why the Homeless Problem is growing. It pretty much explains why Democratic Socialists are popping up everywhere. It pretty much explains why there is a public outcry for some type of relief. The change in housing…not simply appreciation…but the disappearance of some lower income options being replaced by truly Luxury Priced options is astounding!

I didn’t separate the types of residential properties. I usually do, but in this case it really doesn’t matter WHAT the 919 less than $170,000 options were (red graphs below). That the number dropped to 34 is eye opening. Maybe they were manufactured homes. Maybe they were the “crap” houses newcomers often complain about. Still they were homes, and maybe to some extent this explains why people in that income bracket now have to live on the street or in their cars or in campers parked in someone’s driveway.

I’m posting these here as part of a bigger conversation somewhere else. The stats are not 100% accurate as many builders buy their low end teardowns off market and many high end homes are custom built or sold outside of the normal listing system. But given what we have to work with…this is a tale that deserves an in depth study. Clearly those reaching out for solutions to the Homeless Problem should be armed with some data like this showing prices have not only gone up…large numbers of people have been displaced. This doesn’t even count the number of apartments that tossed out all the renters and converted to condos since 2004. Just a huge change in the name of progress.

I have to admit I was dumbfounded by all of the angst against the Tech Companies in recent times…but looking at this data, well it all makes a lot more sense. Doesn’t it?

(Required Disclosure: Stats in this Post are not Published, Verified or Compiled by The Northwest Multiple Listing Service.)

Another reason I have been working on Stats is because the DOW just went up over the January 26, 2018 Peak and so is technically out of the Correction Phase. Median Home Prices should reflect a 10% to 20% downward adjustment from the 2018 peak by year end. But looking at where we are…that’s not going to help much. Is it?

2018 Home Prices in Redmond 98053

Before the graphs, time to mention that there were 572 homes sold in Kirkland 98033 last year, 625 homes sold in Kirkland 98034, 620 homes sold in Redmond 98052 compared to 352 sold in 98053. The 2 active listings at $2.5M+ are extremely large land parcels with a home on each.


More Zip Codes to follow in subsequent posts. Some will be Eastside and some will be Seattle, but only in places where I work, so mostly North of Downtown in Seattle plus Shoreline, Kirkland-Bellevue-Redmond, Issaquah-Sammamish and bit of Bothell on The Eastside.

ARDELL DellaLoggia, Sound Realty – 206-910-1000 cell – ardelld@gmail.com email

Required Disclosure: Stats in this post are hand calculated by ARDELL in Real Time and not compiled, verified or published by The Northwest Multiple Listing Service.

Related Posts
2018 Home Prices in Kirkland 98033
2018 Home Prices in Kirkland 98034
2018 Home Prices in Redmond 98052

2018 Home Prices in Kirkland 98034

First the graphs…


Again, similar to my 98033 post earlier today, there is nothing for sale and not unusual for this time of year. The height of the For Sale and Pending graphs is the average # of homes sold in one month based on 2017 sales IF every month were the same. In 2018 in 98034 it will still be the same “what’s new this week” with everything coming on being sold in a week or less unless it is overpriced.

The main reason for me to post these by zip code snapshots this time of year is for people who need to know where they can afford to live. In that regard, Kirkland 98034 is much more affordable than Kirkland 98033. So when you say you want to live “in Kirkland”, not that by price point you may mean what is sometimes called “the other Kirkland”.

Again, I have coded the more likely price ranges in green tones. But given compared to 98033 the green tones in 98034 all bulk up between $500k and $1M, much unlike 98033 Kirkland, I have added a 2nd pie chart breaking the affordable prices into smaller, 100k, segments.

The big NEWS segment of these 98034 stats is that a large number of pending sales are in the $1M to $1.250M range. Only 44 SOLD in the price range in 2017, but ore than half of the current pendings waiting to close (mostly if not all new construction) are in this price range.

The DOW just went over 25,000 this morning and there is no product for sale. Expect another big climb in prices in the first half of 2018.

More Zip Codes to follow in subsequent posts. Some will be Eastside and some will be Seattle, but only in places where I work, so mostly North of Downtown in Seattle plus Shoreline, Kirkland-Bellevue-Redmond, Issaquah-Sammamish and bit of Bothell on The Eastside.

ARDELL DellaLoggia, Sound Realty – 206-910-1000 cell – ardelld@gmail.com email

Required Disclosure: Stats in this post are hand calculated by ARDELL in Real Time and not compiled, verified or published by The Northwest Multiple Listing Service.

Related Post 2018 Home Prices in Kirkland 98033

2018 Home Prices in Kirkland 98033

First the graphs…


Of course there is nothing for sale, but not unusual for this time of year. The height of the For Sale and Pending graphs is the average # of homes sold in one month based on 2017 sales IF every month were the same. In 2018 in 98033 it will still be the same “what’s new this week” with everything coming on being sold in a week or less unless it is overpriced.

The main reason for me to post these by zip code snapshots this time of year is for people who need to know where they can afford to live. For instance if you want to buy a house vs a condo and you want to spend less than $500,000, now you know that only 6 properties sold in all of 2018 for less than $500,000, so you may be barking up the wrong tree in 98033. I will try to post this same data for the zip codes where I work, today if possible, to keep everything on an even keel.

I have coded the more likely price ranges in green tones, the not likely ones in red tones (but somewhat more for sellers than buyers) in the pink-red and the yes, but be discerning please, are blue.

That inventory is non-existent should not be a surprise to anyone. Only FOUR houses for sale under $1.25 Million might be a bit surprising to some and NONE under $500,000 might be a surprise to some before reading this post and viewing the first graph.

The DOW just went over 25,000 this morning and there is no product for sale. Expect another big climb in prices in the first half of 2018.

More Zip Codes to follow in subsequent posts. Some will be Eastside and some will be Seattle, but only in places where I work, so mostly North of Downtown in Seattle plus Shoreline, Kirkland-Bellevue-Redmond, Issaquah-Sammamish and bit of Bothell on The Eastside.

I posted the Pending sales as well so that people can see what recently sold but didn’t close yet. Not quite as bad as the For Sale stats, but still pretty dismal…or GREAT!…depending on whether you are a buyer or a seller.

ARDELL DellaLoggia, Sound Realty – 206-910-1000 cell – ardelld@gmail.com email

Required Disclosure: Stats in this post are hand calculated by ARDELL in Real Time and not compiled, verified or published by The Northwest Multiple Listing Service.

Related posts 2018 Home Prices in Kirkland 98034

Best Place To Live – Testing Your Parameters

CornerSeattle Area – Choosing Best Place to Live. I recently received a request to write a new post on this topic. Even I find most of the articles I have read on this topic to be very confusing. Like this one that mixes a few “Really?!?” with the obvious best places. Or this one that jumps from one extreme to the other pretty quickly back and forth.

If you are renting vs buying you can use the lists of Best Places to Live in the Greater Seattle Area pretty freely, as you can skip around at the end of each lease until you find a place you may want to permanently call “home”. But if you are buying a home, you need to dig a lot deeper before spending your hard earned money, as switching out is costly and easier said than done.

Since this post is by special request, I asked the requester to give me some basic parameters he has set before beginning his quest as to where to find that type of home, at that price, in the “best” area his money can buy.

With inventory so very low and “best” homes in best areas selling very quickly and often with multiple offers, you can shorten your time frame dramatically by testing your parameters in advance. This way you will not be waiting and waiting for something that simply does not exist in the area you have targeted to search.

Again, these are parameters given to me by an unknown person in an email request to write this post, and not necessarily in the order given.

1) SCHOOL RANKING

The stated objective was:

Elementary School Ranking = 9
Middle School Ranking = 9
High School Ranking = 9

I think we can assume that this person is referring to GreatSchools.org when noting a 9 ranking. The thing that strikes me as odd is that there is a specific number vs a range like 8 to 10. Many if not most of my clients who have school ranking as one of their parameters will most often want 8 to 10 rank for Elementary School. That is a reasonable and common request at Elementary School level but not on all 3 levels.

What bothers me most about someone asking for “a 9 ranking” for school is it leads me to the conclusion that this person thinks school ranking number is a constant vs an ever changing number.

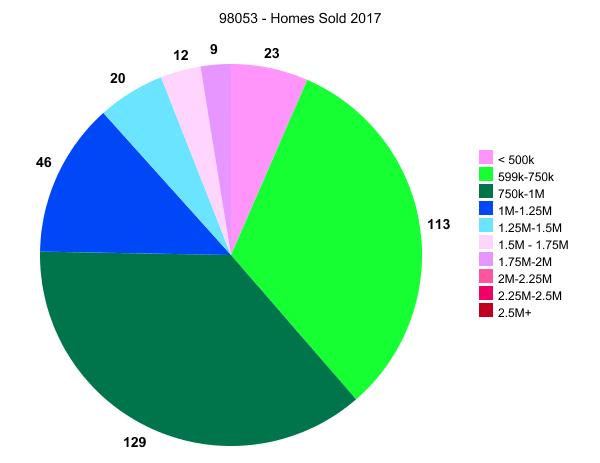
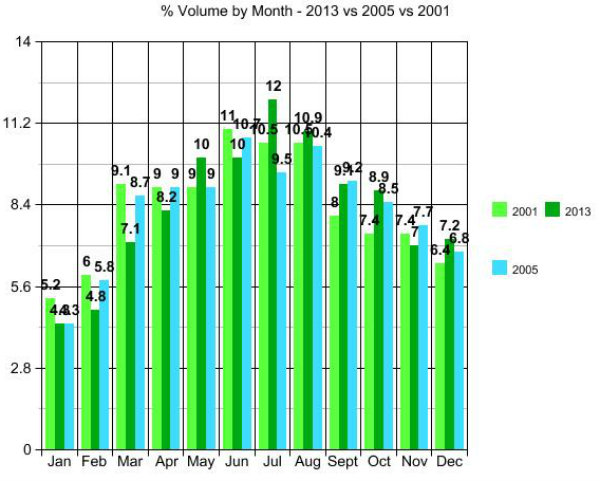
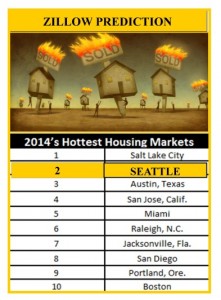
Let’s jump to the areas noted by the person who requested this post and see how this one main criteria alters and narrows even these modest area parameters. Referring to the photo above, nothing “paints you into a corner” faster than School Ranking as a parameter.

“Hopefully Eastside, Bothell, Kirkland, kenmore, Issaquah, Sammamish.”

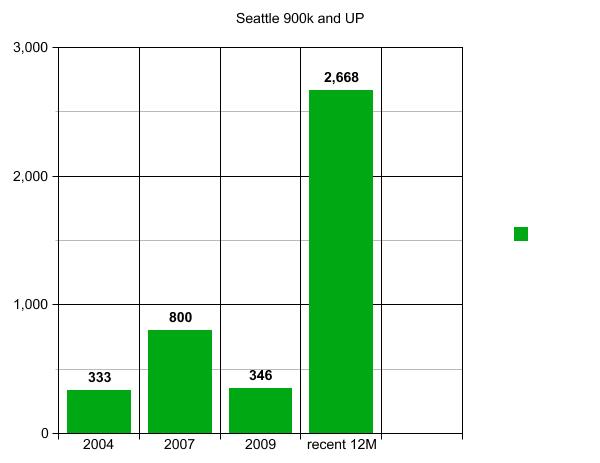
There are only a couple of high schools currently ranking as high as 9 or better in Seattle. But since this person noted Eastside let’s skip over that for a minute except to say Ballard High School riding high at 9 right now is a big factor in the price run up there.

Kirkland is out, though one of my personal favorite Best Places to Live, given there are only two high schools Juanita weighing in at a 6 and Lake Washington High School weighing in at a 7. I clearly would not rule out Kirkland, but when I first saw this email I thought, well I guess it’s going to be Sammamish…maybe Issaquah, to get all 3 schools ranking as high as a 9.

Bothell High School is running at a 10 as is Inglemoor in Kenmore. Would I or most of my clients exclude Kirkland in favor of Bothell or Kenmore? Not usually. So really have to be careful about the corner you are painting yourself into with this requirement. All things considered, some of which are not in this post yet but are in the email, I’d still be at Issaquah-Sammamish and probably Issaquah I-90 corrider for this particular person.

My general advice for people planning to have children or with very young children just starting school, is to set your ranking based on Elementary School only. Middle school is a can of worms mostly having to do with puberty. Limiting by High School rank leads you into a very small corner, which may be fine as long as you happen to like that particular corner.

– Below $425,000 (may be even going up to $500,000)
– single family home
– town home with no to very low HOA
– area where property value is appreciating. If I buy now (resale after 5 years should be a profit)
– crime should be low
– commuting to Downtown Seattle should be good.
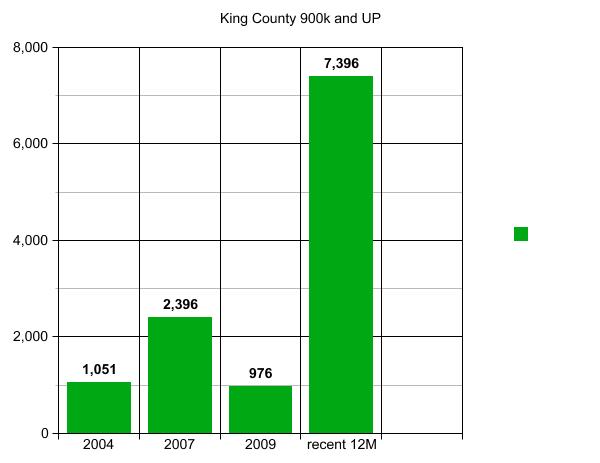
– King County
– newer construction
– few foreclosures in the general area
– areas with construction quality/grade of 8 or more.

Let’s hit these quickly:

King County OK though you can find lower prices outside of King and the Bothell option changes since most of Bothell is not IN King. I’d still be at Issaquah for that reason.

Newer construction…well depends on how you define “newer” but lets say 1995 or newer since home styles haven’t changed much in that time frame.

Few Foreclosures in the general area – When you have a school ranking of 9 or better and a low crime criteria, you usually don’t run into foreclosures generally except in a neighborhood where everyone bought at peak because it was built and sold at peak.

Low Crime is a given on the Eastside for the most part in the Cities mentioned, so not a big factor.

Commuting to Downtown should be good is where I get stuck as to Kenmore which is not known for its “quick commute” to most anywhere.

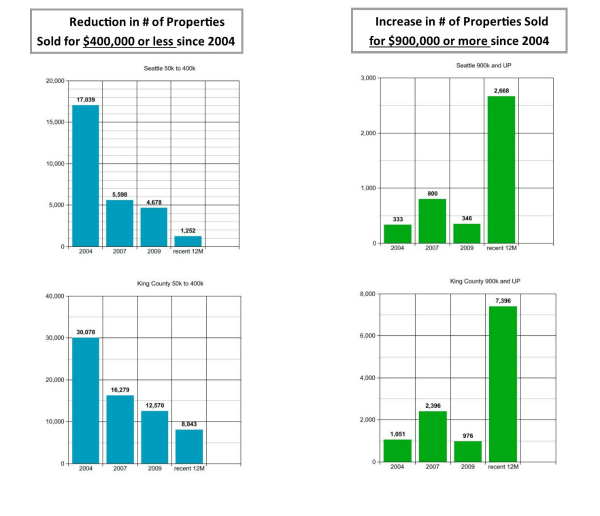
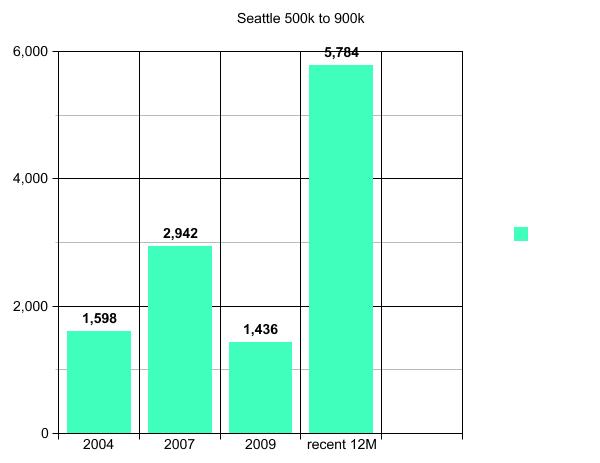
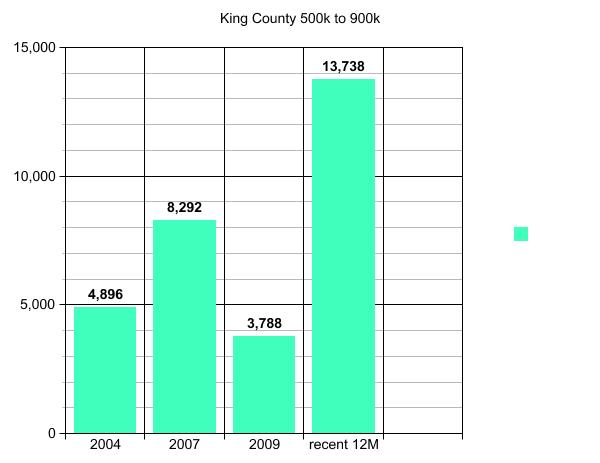
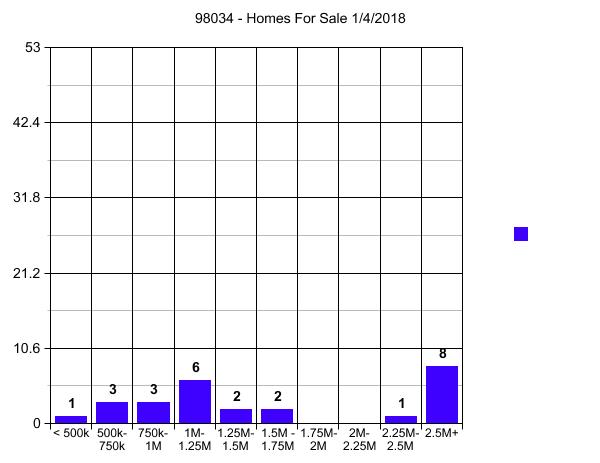
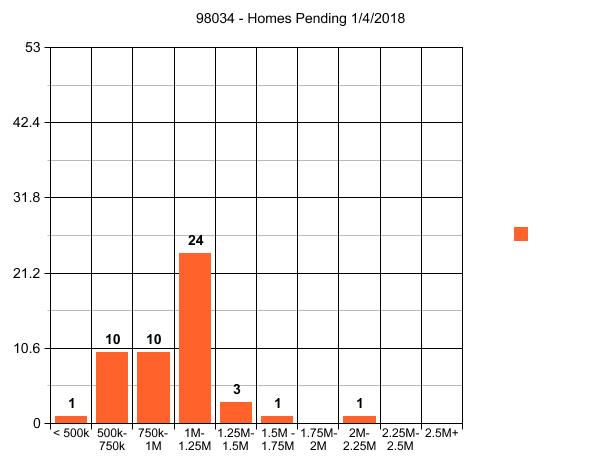
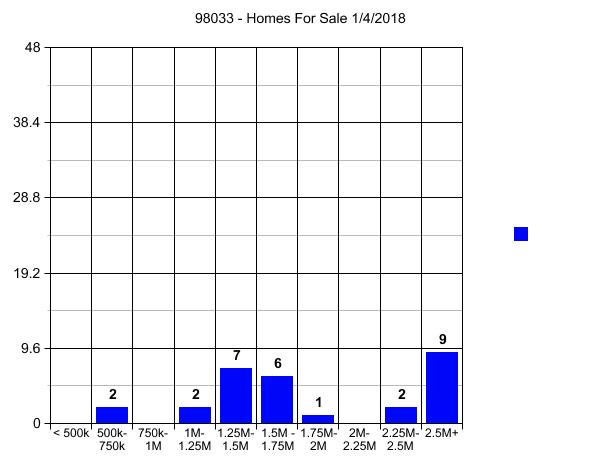
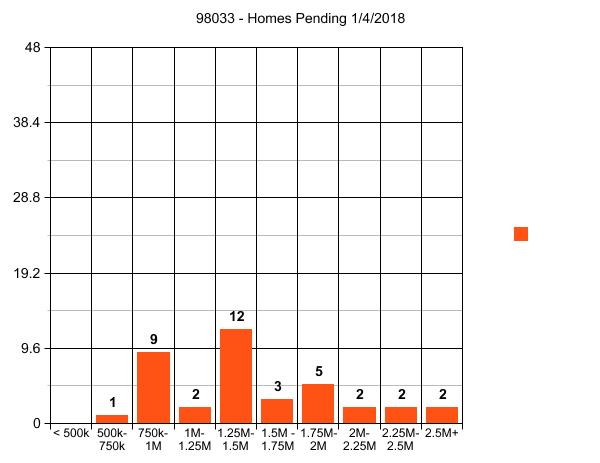
That leads us to the big one…price.

PRICE OF HOME

I ended with price, but in real life vs a blog post I START with price, because nothing draws a hard line faster than how much you can afford to spend.

I’m thinking Single Family Home is now out of the question and we are moving straight to townhome if “newer” is 20 years or less and High School is 9 or 10. Then we run into HOA dues that are likely going to be considered excessive. Let’s assume for a minute HOA dues of $300 a month and an interest rate of 3.75%. Now we move price to a $425,000 Townhome or a $485,000 Single Family Home being the same, given the $300 monthly dues value at $65,000 of price.

Here’s where the person who asked the question gets to go back to the drawing board with these questions.

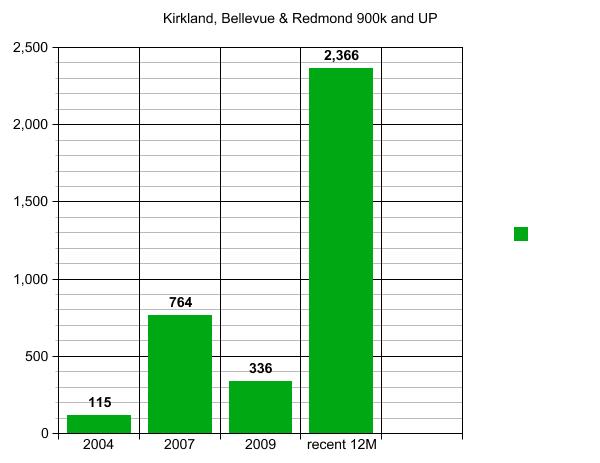
1) If Kirkland only has two High Schools ranked 6 and 7 are you ruling out Kirkland altogether?

2) If the only place in Bothell that meets your parameters is in Snohomish County vs King County, do you drop the King County requirement? Bothell runs into 3 or 4 different School Districts pretty quickly.

3) If the only way to get a Single Family Home is to buy an old one vs a new one, do you stop at townhome or change the age of home criteria?

Without having to change anything you can get a newer 3 bedroom townhome in Issaquah High School…possibly Skyline High School, and pretty easily match that up with a high ranking Elementary and Middle School. Many if not most of these are close to I-90 for a pretty fast commute into Downtown Seattle. If 1995 to 1998 Single Family Home appeals to you more than a new or newer townhome, then Issaquah still an option.

Play with your own parameters now. Go to GreatSchools.org and put in the Cities you are considering and set the High to Low on Rank and you will easily see which schools you want to consider, or not, and note them by name. Once you have your complete list of schools it is easy for your agent to find the neighborhoods within those schools that fit your price parameters.

Point being that when you are using school ranking as a consideration you start there and you, the buyer, do the research to make an accurate and complete list of all schools that are an option for you. It is a parent’s job to pick schools…or not. When using this method it is then better to have an agent set you up in the mls for alerts than to use a public site, since it is pretty much the only place where you can put in a big list of schools vs setting up separate searches for each school. That still leaves you in a bit of a jam since individual schools is not a “required” data field. BUT if you start at finding the neighborhoods by looking at sold property over the last year or more…well, it’s a good start and good luck.

Personally, and for most of my clients, they pick their BEST WHERE first…and then find the best schools in that where, vs painting themselves into the corner of only being able to live in one place. Overall if this were my client I’d be adding Redmond to the mix and then choosing between Issaquah and Redmond.

As to Grade 8 or better as to construction, that’s pretty much a given after piling in all of your other parameters. 8 is not very high as to quality grade and new or newer construction is usually an 8 or 9 in modest price ranges. I just spot checked several and most all in that price range are an 8. So leave that check point for last after you find a home and before you make an offer.

Real Estate – Why DATA is the New Black

Early Friday evening one of my favorite long term clients asked me this question: “Why is the market so slow these days? I have an alert for ($) houses in (zip code) and I barely get a couple of hits every week west of (the freeway). Almost always tear-downs.” (actual specifics from his email removed)

My first data set pulled was a line up the number of homes sold where I primarily work (North King County – North of I-90), by month, over the last 6 years from 2009 to 2014 YTD. This to answer only the first 8 words of his question “Why is the market so slow these days?” The easy answer would be “because it is past October 15th”. I test my knee jerk response by pulling all of the relevant data to be sure I am not answering like grandma in a rocking chair pulling some now irrelevant data from her long term memory bank. I also do this because I need to discover why this person’s current perspective may vary from the long term norm.

Something may recently have happened leading this person to believe that the standard progression is no longer the realistic expectation. I value his thought process as part of how I answer the question…by first pulling the data…lots and lots of data.

The line graph below documents the data pulled for the last 6 years. But as I almost always do when pulling stats, I went back 12 years because data expires! More on that in graphs 4 and 5. Since I almost never regurgitate already documented data from other sources, but rather only trust the data if I calculate it myself, I usually go back as far as my data source will allow, which in this case was 12 years.

First I test my perception that 2014 is not a low inventory year, even though there are tons of articles saying that inventory is low. Many articles talking about the frustration of buyers with “low inventory”. But look…no…my perception is indeed correct. The red line is the “low” or at least the first half of 2009 depicted in the red line. The green line of this year is not only NOT “low”…it is pretty close to the high over the last 6 years.

To be clear, I am using “homes worth buying” as “inventory” and the proof that they ARE homes worth buying…is someone actually bought them.

Volume 2009-2014

After I peruse some of the recent data as an attempt to start at the point where he may be coming from when asking the question, I dive into my own “expert opinion” perspective, which is my 2001 baseline. This information is really already carved in my brain, but since I turned 60 this year I figure it wouldn’t hurt to double check that my memory is still accurate. 🙂

Volume 2001 baseline

I actually did all 12 years before honing in on the actual answer to the question, which comes from comparing 2014 with 2013 and 2013 with both 2001 and 2005.

To determine which were the correct comparison years, I had to first pull ALL of the data that the data source would allow.

While yes…my knee jerk answer of “because it is October” would have been correct, by pulling all of the data I can see from the variance of the actual stats from 2013 against the baseline of 2001 exactly why the question made 100% sense from this person’s perspective at the time he asked it.

This person, along with every average homebuyer, is looking week to week over a period of 6 months to 18 months for a home to buy. They have no “baseline perspective”. Their expectations come from more recent history’s actual activity, and rightly so, with no way to tell if the last 6 months was exceeding or under performing standard market expectations.

The bar graph below explains where the expectation may come from. I have 2005 in there just because it is the one year over the last 12 years when the most number of homes were purchased (ipso facto “available” to be purchased), so highest inventory year. But the key to answering the question is in the 12% of June 2013.

If you look at every piece of data on this page which looks at all 12 months for all 12 years in 6 different comparative charts…12% of a full year’s total inventory being available to buy in one 30 day period is pretty much unheard of! That was June of 2013.

I had another client who started looking in early 2013 and did not buy the house they could-should have purchased in June of 2013. After that they were progressively and continuously disappointed with the number of homes that came on market for months and months afterward. They had no way to know that the volume of homes coming on market since they started looking were many more than the normal market expectation.

In hindsight every subsequent month looked pss-poor in comparison. Pretty much all activity if you started looking in April of 2013, and didn’t purchase by June-July of 2013, is looking relatively dim. BUT in reality inventory is not dim. Inventory, the number of homes you can expect to choose from, is in fact currently performing at or over market expectations adjusted weekly for seasonality. All this can be gleaned from the 12% spike in that bar graph, noting the rational explanation as to why your expectations may be “off” by comparing relatively recent actual data against 12 years of data comparisons.

Basically that makes us both right. I’m right at “because it’s October” and the person asking the question is right to consider the options dim based on more recent relative comparison.

Volume 2001-2013-2005

Posting the data and graphs that helped formulate the above. Worth noting, while I brought forward the Red Line year of 2009 to note inventory low point, the graph below shows that the 12 months of low inventory started in the 2nd half of the gold line of 2008 and proceeded to the lowest point of Jan and Feb of 2009, which some of my readers may remember as “my bottom call” that made front page news at the time.

Volume 2005-2008

Looking above and below at the thick green line of 2014 inventory against the high inventory years of both 2004 and 2005 you can easily see why all of the articles calling 2014 low…and actually they were saying that last year in 2013 as well, are simply not true.

Volume 2001-2004

While my analysis will continue to use 2001 as a baseline, you may want to use the bar graph below to set your expectations. This is the average good homes on market based on the average of 12 years worth of data.

I use 2001, as many of the variances over the last 12 years are influenced by Tax Credit Incentives coming in and out and artificial interest rate jockyings…not to mention all of the massive changes in loan approval criteria over this same period. For that reason 2001 is still the purist baseline by which to compare and contrast other market influences as they come and go from time to time.

WHY IS THE MARKET SO SLOW THESE DAYS?

Getting back to the first 8 words of the original question…because based on normal seasonal activity you can expect that there will be HALF the number of homes coming on market that are worth buying by December than in May. “coming on market” activity is the month prior to the sold month. So highest SOLD volume in June will = highest number of instant alerts of new listings coming to your phone in May.

Expect the numbers to increase from December through May and then begin a decrease through year end before beginning the next climb.

Volume 12 year average

WHY IS DATA THE NEW BLACK?

Because it saves you time and reduces your stress to DRILL down the data from the general comparisons above and fine tune your actual parameters before you waste any time looking for something that doesn’t exist in the place where you are looking. That brings us to the 2nd and 3rd part of this person’s question ” I have an alert for ($) houses in (zip code) and I barely get a couple of hits every week west of (the freeway). Almost always tear-downs.” (actual specifics from his email removed)”

Only 25 houses were sold using a full $150,000 spread with your $ amount as the cap in the whole 6 months of “high season”. So expecting 2 a MONTH in low season let alone 2 a week…is an invalid expectation. Expect ONE really good one a month from here to February of 2015.

“Almost always tear-downs” means you are looking for a nice home at the price of the land alone. Again an invalid expectation. Changing your price to what that home will sell for there is not an option. Changing your choice of what to a tear down is also not a reasonable option.

The only answer to your dilemma is to change the where and not the price or the what.

(Required Disclosure: Stats in this post are not compiled, verified or published by The Northwest Multiple Listing Service.)

VERY “Walkable”…but is it SAFE to walk there?

walkscoreI am very happy to report yesterday’s news that WalkScore has added a crime overlay, something I have been asking for since WalkScore first came about.

Local residents often roll their eyes when they see an awesome walk score attached to an area where it is simply not very safe to walk after dark AT ALL. Not a big problem for local residents, but what about the many people relocating to The Seattle Area who are relying on various internet tools to guide them in their search for a home in their new City?

I have not tried the new tool out extensively, but from what I have seen the crime grade does NOT reduce the walk SCORE, so a previous score of 87 will still be a score of 87. BUT if you take the time to study the color coded crime map after viewing the score, you will be better able to judge an area now than ever before. Previous to this change I have always recommended that people use Homefacts.com to pull the crime data and photos of local registered sex offenders. Not sure if the changes to walk score will replace that need or not, but I am very happy to see that they are finally acknowledging that some very “walkable” neighborhoods as to their scoring…are in reality sometimes not very safe to walk in at all.

Try it out, as I will, and let me know what you think.

How much for stainless appliances?

Stainless has become a preferred color option. Most people who say “stainless” are not always talking about expensive Stainless STEEL. As long as the color is the same, most people don’t care. Easy way to tell if it is Stainless “Look” is to carry a fridge magnet when you are shopping for appliances or houses and if the magnet doesn’t stick to the front door then stainless is the color and not the material used.

For this post I am pricing out some basic upgrades for a client. Earlier today I did the carpet cost and now am moving to the appliances. We’re looking for relatively low prices for standard sized everyday appliances. The type you might use if you were selling a property or upgrading a modestly priced home. A quick change in the look from white or black and basic clean and new appliances. Nothing too fancy.

REFRIGERATOR

I would say $1,000 or less including tax and delivery. I found a few good ones for about $750 which are sometimes $685 or so on sale. There are many in the $800 to $900 range. The property has a standard opening from the 1970s, so 18 cubic feet or so at 65″ high and 30″ wide will probably fit better than a 21 or 22 cubic foot fridge that requires more height between the floor and the upper cabinet of about 70″. For the family I’m doing this for, the $750 fridge on sale for $685 shown in the picture below should be fine. This would work for any full sized 30″ wide opening. The opening is usually 32″ to 34″ and the 30″ has a little room on both sides.

RANGE

In this case we will be using a standard 30″ wide electric range in mostly stainless and partly black. I will post all the photos together at the bottom so the client can see how they look side by side. For some reason the power cord is often sold separately and the total cost should come in at around $650. The lower priced ones are black or white and we want to stay with a full stainless steel or stainless look result in the kitchen.

DISHWASHER

All of the appliances are white and we are replacing with stainless, but worth mentioning that the current appliances are all in working order and can probably be sold on Craigslist for a few hundred dollars for all of them or donated to charity for a write off. Most people just let the company bringing the new appliances haul them away. But I do have a few resourceful clients that sell everything, like the young man who actually sold his old carpet that he tore out. 🙂 I haven’t had to replace a dishwasher when selling a home…well pretty much ever. So I’m pricing these off of Home Depot. In this case I used a $600 Dishwasher in the photo. You can get a cheaper one in the same black and silver version as the range…but this all stainless dishwasher is so much better looking and impressive in person for a little more cost. I recommend you not skimp on this appliance and not get the one with some black plastic on it. You need some black on the range for the knobs and digital display. But not on the dishwasher. Speaking of which the fridge can have black sides and sometimes better to have that as fridge magnets will adhere to the sides usually if they are black. Since the range is mixed silver and black, that usually makes a lot of sense.

MICROWAVE

I’m showing a picture of a $260 over the range microwave. You can find them a little cheaper or pricier, but we’re just trying to get a total price to move out the white appliances and bring in Stainless Steel or Stainless Look appliances. I thought this one was as showy as the dishwasher, and when the nicer looking one is only $60 more…why skimp? USED TO BE you would just put a range hood there, and nothing wrong with that. BUT the last time I tried to do that with stainless vs white or black…it cost an arm and a leg! Might as well go with a Microwave that has a vent fan. You can look at both, but I wouldn’t pay the same for a plain vent as I would for a Microwave. YMMV

So we’re looking at $700 to $800 for the Fridge. $650 or so for the Range including tax and power cord, $600 or so for the dishwasher and another $250 for a microwave or $2,200 to $2,500 total. Roughly the same price as the carpet in the other post. So let’s say we are at $5,000 for all new appliances in the kitchen and all new carpet in the house. Not bad.

First pictures of the kitchen appliances, then I’ll move to washer and dryer which can be simple full sized white top load washer and front load dryer. Note that I just cut and paste these pictures together. I didn’t put model numbers or brand names as you want to be sure they are matching color. Usually best to stick to one brand name for that reason or at least see them together in a store. If you buy the full 4 piece appliance package in the same store you can usually get a better deal of about 20% off.

appliances

I’m just going to throw in the washer and dryer at $1,000 for both. People have been getting carried away with washers and dryers costing $3,000 or more for both. But for the purpose of this modestly priced home and knowing the clients as I do, they actually can probably do all of this including the washer and dryer, kitchen appliances and all new carpet for $5,000…$6,000 tops.

Seattle listed as 2nd hottest housing market for 2014

The new Zillow predictions for the 2014 housing market show Seattle as the second hottest market in 2014.

They also predict only 3% increase in prices overall, so “hottest” could be kind of cool. 🙂

Personally I think it all depends on how many sellers come out to play this year. You will have your same average turnover for must sell reasons. Relocations as example. But with most sources predicting a slower increase in home prices and possibly a slight turn down, perhaps those sellers waiting for a better housing market will succumb to the fear that it might not get any better than this.

No one knows how “hot” the market will be, but the more sellers there are the “better” it will be whether there is growth or not. Zillow is also predicting rates will get to 5% by year end, but that looks more like someone trying to create a sense of urgency whereZC there really isn’t one.

Teaching Realtor Clock Hour Classes in Washington State: Getting Started

I’m writing this post because I am often asked how to get started teaching Realtor clock hour classes.  There are a million ways to answer this question.  Do you want to know what the state requirements are? I can easily point you in the direction of Washington State’s required forms but the form won’t tell you how to get up and running. This form will tell you how to get yourself approved as an instructor.  Getting up and running is a different question and that’s the question I will answer in this post.  I have found that the best way to help people is to start at the end.

What’s your end game? Do you want to teach Realtor clock hour classes because you want to make a lot of money? Maybe you don’t care about the money because you have some other job where you already make pretty good money but instead want to use the classes as a way to get in front of Realtors so you can show them how awesome you are…so they will refer business to you.  I have found the latter to be the most common reason why people want to begin teaching Realtor clock hour classes. But let’s talk about money first.

Money

There isn’t a whole lot of money in teaching live classes because…well…because there are so many vendors who are willing to teach low quality CE classes for free.  There are also many large companies willing to send one of their full time employees to teach classes and at conventions for free. These instructors have full time jobs in management, sales, law, tech, etc., and teach classes or at conventions as a public relations maneuver for free, or for a very, very low fee. There’s a word for it. I call it sales-ucation.  Big conventions only pull out big paychecks for the big name draw convention speakers.  I’m assuming you’re not a big name convention keynote speaker if you’re reading this article so I’m going to tell a secret to the rest of you who are not sales-ucation speakers.  There always IS a budget of some sort and they always WILL pay you something—if you ask.

Money, continued
Three Puzzle Pieces: Teaching, Writing, Warm Butts

If you are looking to teach Realtors as a career, AND you can write your own classes you’re on your way. The last piece of the puzzle will be—how are you going to get warm butts in chairs?  You need to be able to do all three: Teach a kick-ass awesome class, constantly write new material, and have a marketing machine that delivers students into the classroom.  Most people who want to teach….want to teach and that’s it.  They want to walk into a classroom filled with students and walk out with a paycheck.  If that’s all you want to do, your value to a real estate school is really, really low.  But that’s okay, and there are real estate schools out there who may hire you but don’t expect to be paid much per hour or per class.

Vendors and The Numbers Game

Maybe you’re a vendor and…well, now don’t be offended if I call you a vendor.  You might be thinking…..I’m a loan originator! I’m an appraiser! I’m an attorney! I’m an escrow officer!  I hate to be the one to break the news to you but to a Realtor you’re just another vendor. Check your ego over there on the edge of the computer screen and don’t get offended if I call you a vendor.  So vendors typically want to use the classroom as a way to grow their business.  It’s a numbers game.  You get in front of X number of Realtors each month will translate into X number of referrals which will translate into X number of leads which will translate into X number of deals which will translate into X number of closed transactions which, on average, will net you X number of before-tax dollars per month.

This is a great strategy and it is doomed to fail. I will hire no one to work at my company if all Realtors are to you is a dollar sign or a lead in a grand master plan. People aren’t objects.  Students aren’t there to be used and even if you (please don’t) teach your class for free, the Realtors are still paying with their time.  Their time is valuable and if all you are doing is a sales song and dance about how much you know and how awesome you are you will fail.  This is what gives Realtor clock hour classes a bad name.  Instructors are in the classroom to help people learn.  They are not there to sell.

Magic is Mystery

So here’s the magic. As a vendor, I know you want deals. Everybody knows you want deals but if you go in there with your deal-wanting pants on, everybody’s going to know it. Instead, you need to approach teaching like a good book.  Nobody goes right to the end of a good book to find out what happened. It’s a mystery. That’s what makes reading so enjoyable.  If you really want to find success in the classroom, and by success I mean meeting your math goals in the previous paragraph, you need to let go of the outcome and instead focus on teaching an awesome, kick-ass class.  A class better than any class they’ve ever had from your competitor.  If you teach an awesome class, they will call you. You get to pick and choose who you want to work with. That’s right. At the end of a 4 hour class, you will know which Realtors you want to work with and which Realtors you don’t want to work with.

The Good News

Title insurance, mortgage lending, home inspections, escrow, all of these vendors have reputations for delivering “free” classes that are god-awful boring. That’s the good news. The bar for free vendor classes has been set terribly low.  All you have to do is to teach even a marginally decent class and they’ll think it’s the best class they’ve ever taken.

So what’s the difference between a god-awful boring class and a kick-ass awesome class? A class where the instructor DOES NOT lecture.

It’s Hard But It’s Also Easy

The most difficult thing for most all clock hour instructors to get their heads wrapped around is that your mouth doesn’t have to be moving the entire time. Unless you attended a fancy prep school in your younger days, most of us attended school where the teacher did most of the talking and we think we have to do that to teach Realtors.  That “teacher knows everything” archetype is embedded in our psyche.  That’s not what adult learners want from their clock hour instructors. Adult learners want to get involved with their learning and that means you don’t have to be the one talking all the time.  This is hard but also easy.

Step 1

The first step is to get into the right Instructor Development Workshop.  Find out who is in charge of the workshop, who is teaching it, how long they’ve been teaching Realtor clock hour classes and how familiar they are with the facilitation model of adult learning.  There are many IDWs out there.  Some are cheaper than others, some are online. You do get what you pay for. Shop around and ask questions.  Will the instructor answer all your questions about getting up and running during the workshop? Will the instructor help you fill out your state-required paperwork? Will the instructor give you the opportunity to try out the facilitation style of learning so you can get a feel for how it really works?  Find the very, very best Realtor clock hour instructor you know who teaches a lot of interactive, fun classes and ask that person for a recommendation on where to take an IDW.

Step 2

The second step is to figure out if you’re a writer.  If you don’t know how to write classes, don’t want to write classes, or don’t have time to write, then you’ll need to hook up with a real estate school that already has classes written that you can use but remember, no school is going to let you teach their material for free. There will always be a fee involved but you can let the students pay that fee if you don’t want to pay it.  Real estate schools like mine can also help you write something completely unique and brand new.  The class must be written to allow the instructor to give the students lots of things to do. The old-style class just gives the instructor lots of things to SAY.  That is a recipe for a boring class.   Just mailing a set of powerpoint slides to the Dept of Licensing won’t cut it. They want specific learning objectives. Real estate schools know how to write classes that the Dept of Licensing will approve.

Step 3

The third step is to figure out how you’re going to get warm butts in chairs.  The easiest way vendors think they will meet this goal is to offer free classes.  Unfortunately when you teach for free you are telling the Realtors what you have to teach them has no value.  Unless YOU own the real estate school and you own your own courses, you OR the students will be paying another real estate school a fee to use their school and courses. Having your own school is also an option but you still haven’t solved the warm butts in chairs problem.  So until then, make a list of possible marketing partners such as a local Association of Realtors or other vendors that also sell to Realtors.  Whatever real estate school you’ll be working with can also help you with marketing ideas.  You can have a great class and know how to teach an interactive class and then end up with nobody showing up.  The marketing piece is crucial to meeting your goals. Marketing takes time and money.  Just sending out a flyer to your email database of 500 Realtors might net you 5 students. If all you have is emails, you need BIG numbers to net 10 students.  If you don’t even have a database of Realtors you’ll need to buy one or partner with someone who has one.

Other Options

In closing, teaching Realtor clock hour classes is a big time commitment.  Not everyone can meet that time commitment, but they still want to attempt to meet their goals. Another option, without actually taking the time commitment needed to be an instructor, is to just sponsor a clock hour class through your local Realtor association. You bring in some healthy food like fruit and protein bars (can we ditch the donuts and muffins and bagels? All those simple carbs are increasing the LDL cholesterol levels of Realtors as I write this.  Enough of that crap already) and then you have a few moments to address the audience.  This is an option for you to create some face time but that’s all it is. Most vendors don’t stay for the whole class.  Drop and go is the status quo and I’m sure the ROI is not very high.  But it DOES make you feel like you’re accomplishing something if a “feeling” is the goal.

Think about your endgame and if you’ve decided to become an instructor, go back and read Step 1.