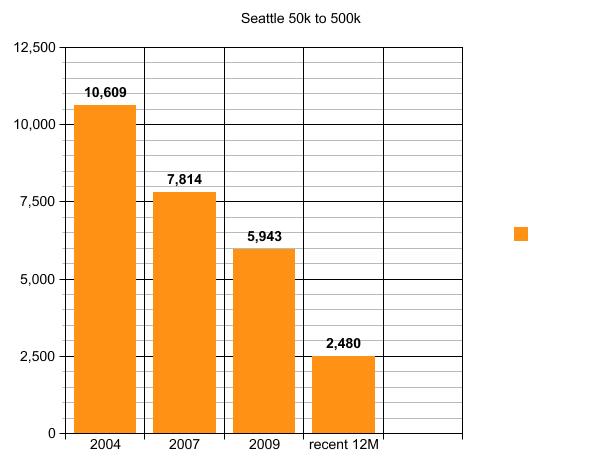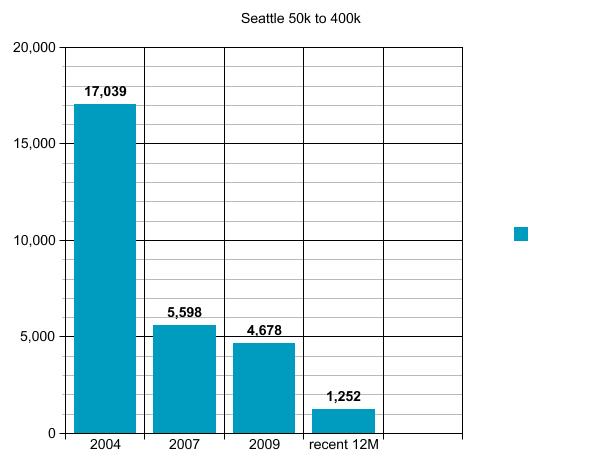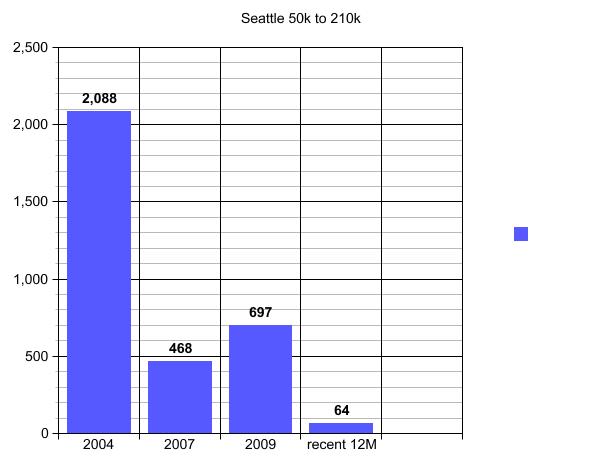
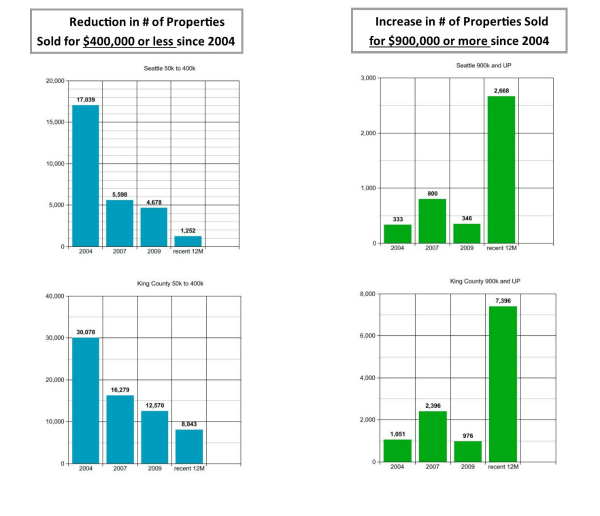
In 2004 over 17,000 Residential Properties sold for $400,000 or less In Seattle. Now…less than 1,300.
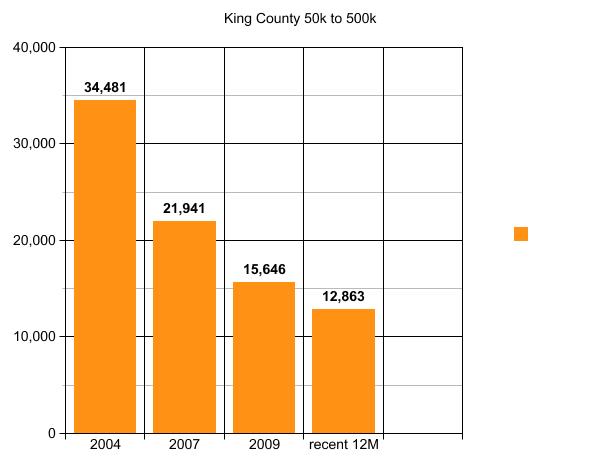
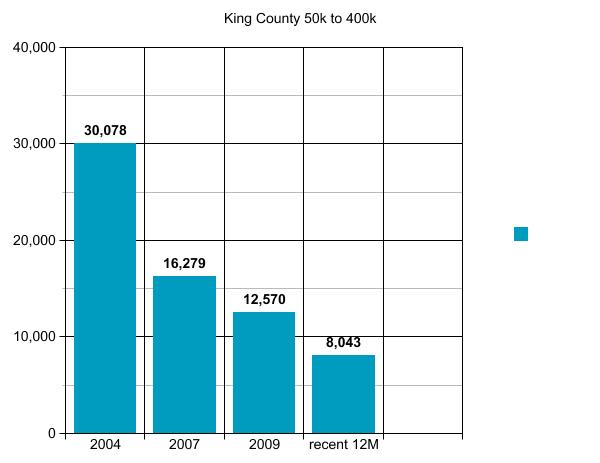
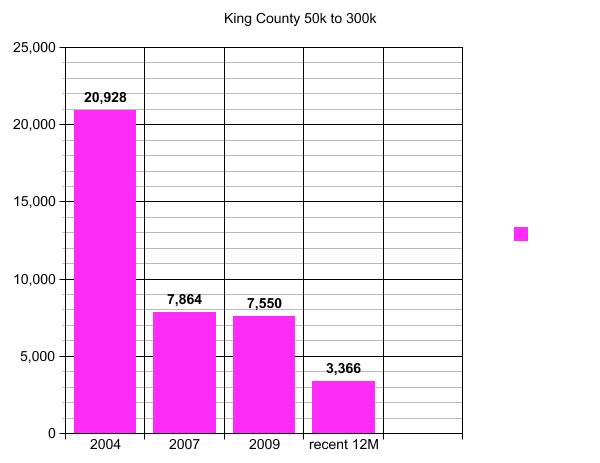
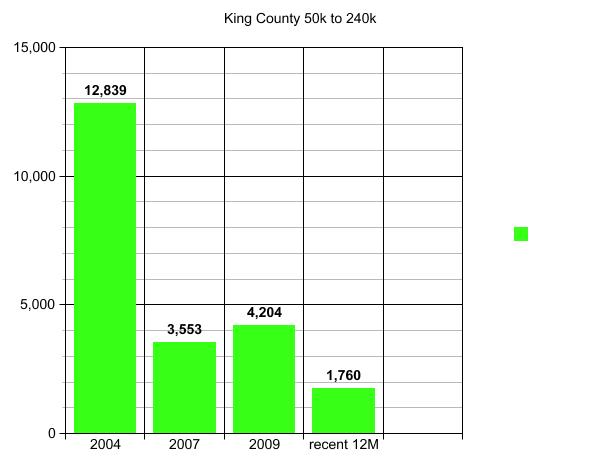
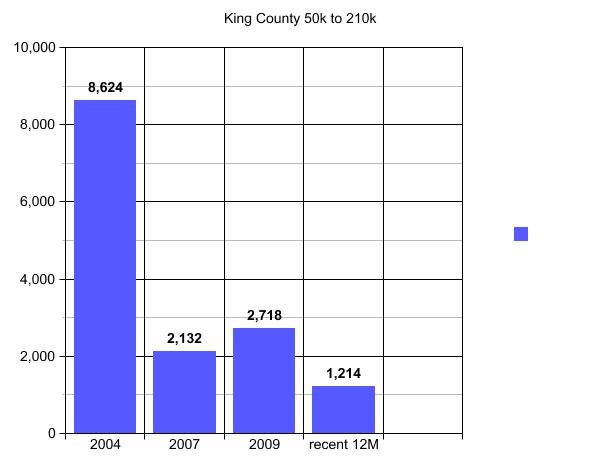
In King County the number dropped from over 30,000 to a little over 8,000.
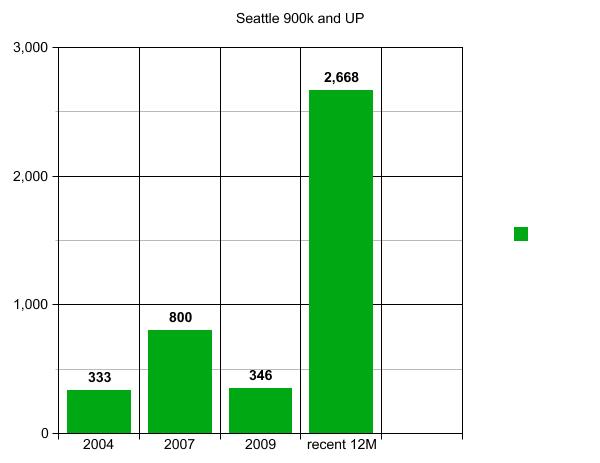
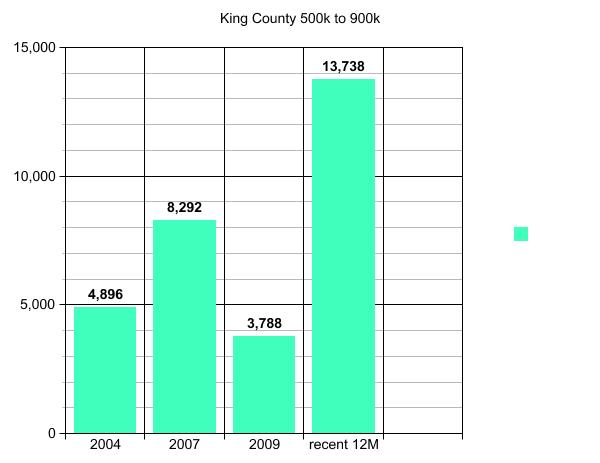
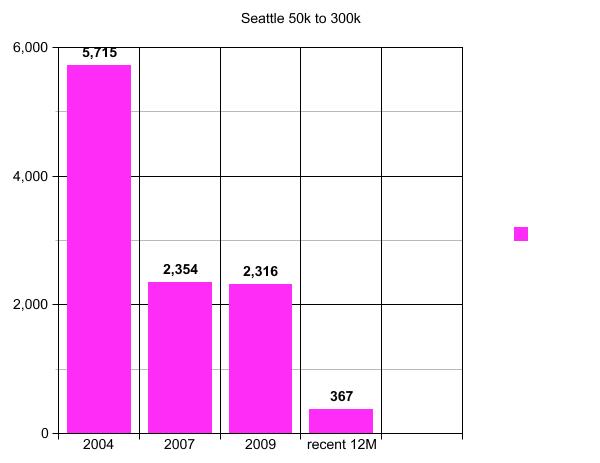
In 2004 only 333 houses sold for more than $900,000 in Seattle. Now…over 2,600.
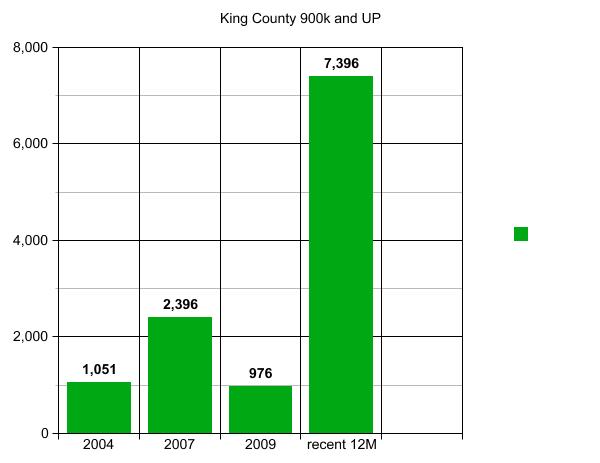
In King County the number increased from 1,050ish to almost 7,400.
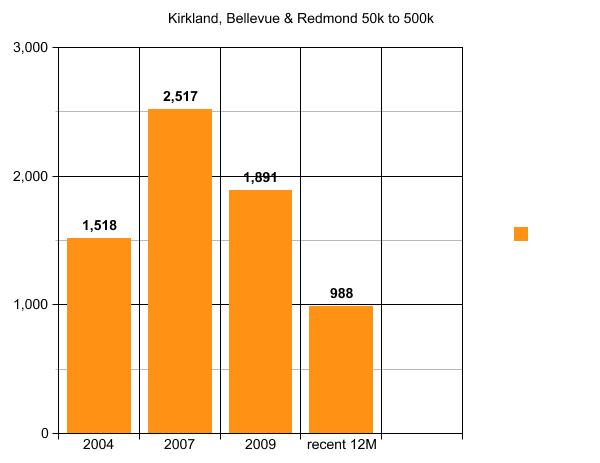
It’s not merely about median price increases. It’s about the displacement of people who are making the median income or less being replaced with a whole different income class.
Here’s a visual.
I was running stats for a different reason. Given the recent change/slump that has been broadly recognized both here and in many places around the Country, it’s a good time to take stock of where we are and where we are going and to some extent…where we need to be going.
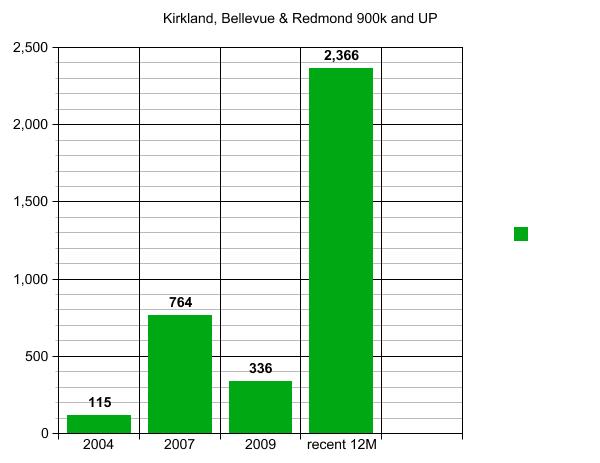
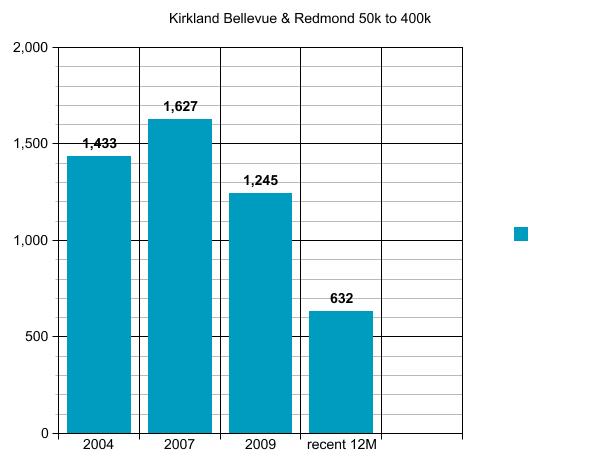
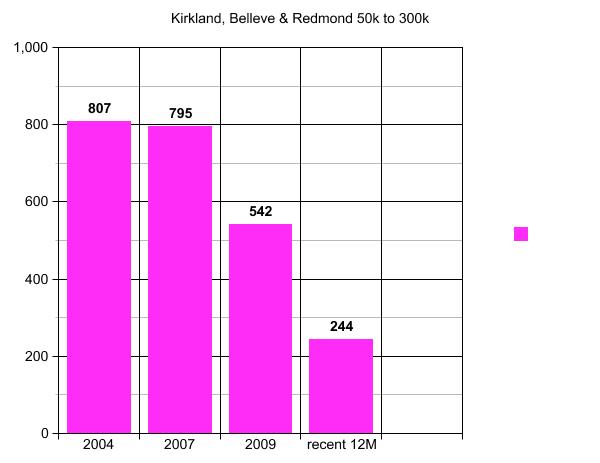
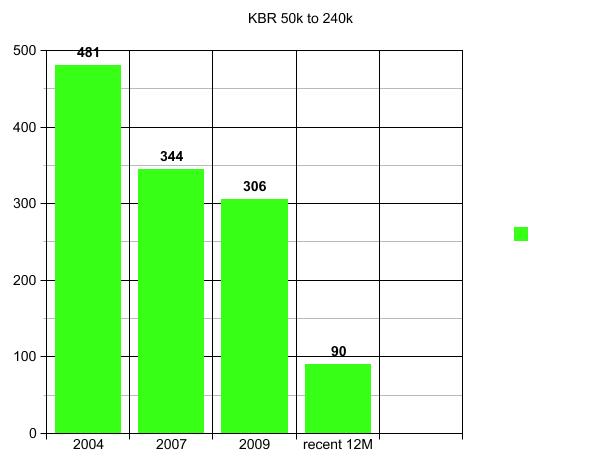
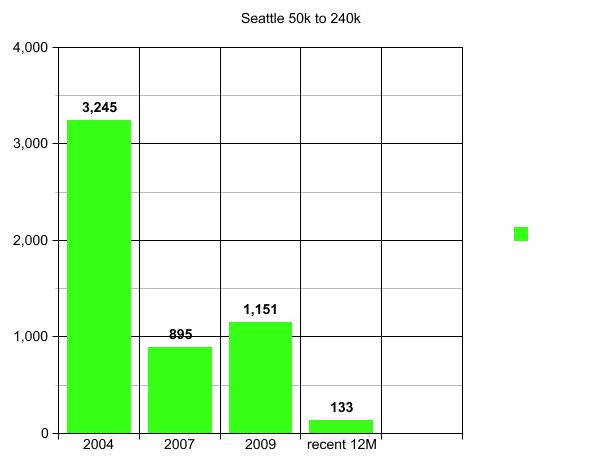
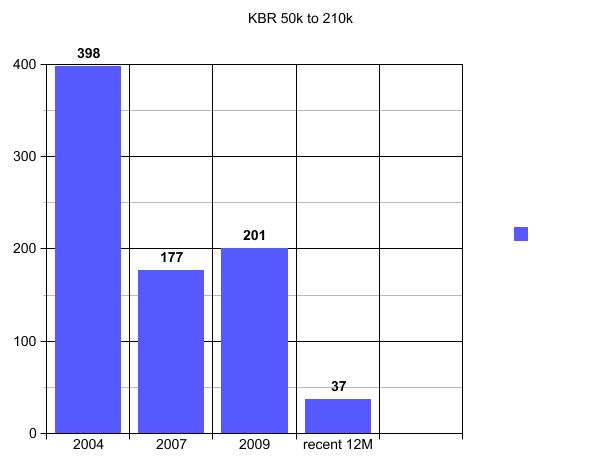
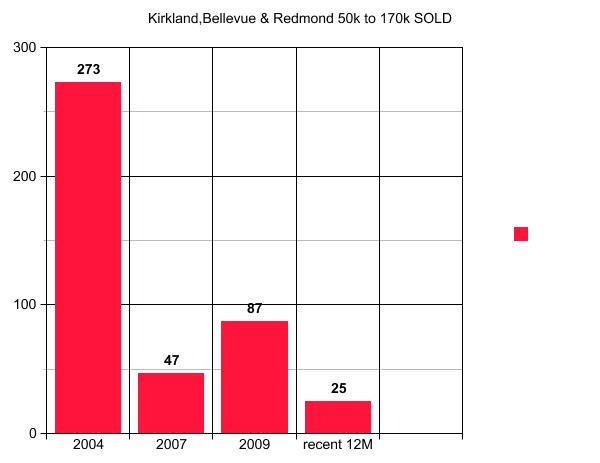
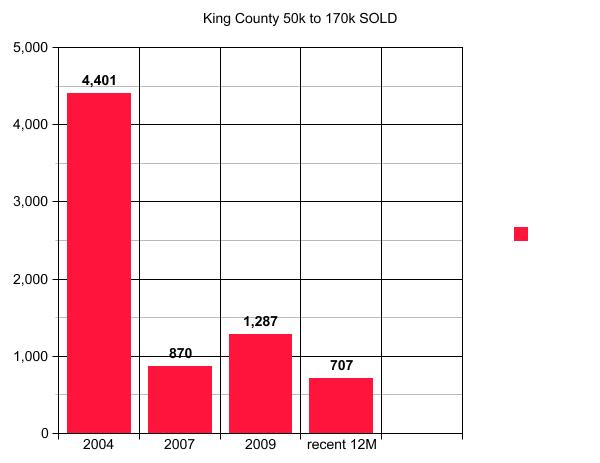
Below is an almost complete visual of all of the stats I was running for King County, Seattle and The Eastside. I used “Kirkland, Bellevue and Redmond” as a brief snapshot of “The Eastside”. Looking at the data is like looking at clouds. Everyone sees something a little different. But for me the top photo snapshot is pretty jaw dropping.
It pretty much explains why the Homeless Problem is growing. It pretty much explains why Democratic Socialists are popping up everywhere. It pretty much explains why there is a public outcry for some type of relief. The change in housing…not simply appreciation…but the disappearance of some lower income options being replaced by truly Luxury Priced options is astounding!
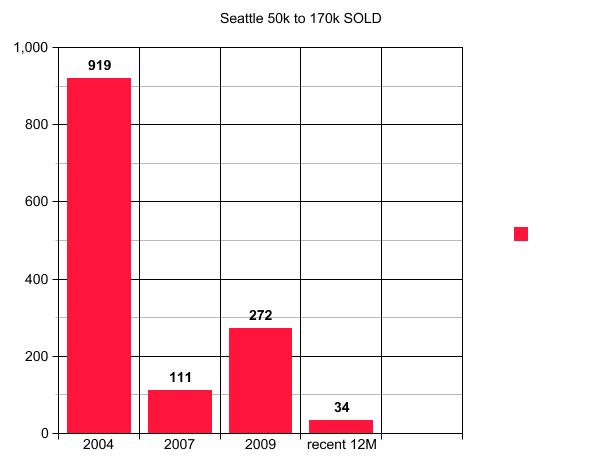
I didn’t separate the types of residential properties. I usually do, but in this case it really doesn’t matter WHAT the 919 less than $170,000 options were (red graphs below). That the number dropped to 34 is eye opening. Maybe they were manufactured homes. Maybe they were the “crap” houses newcomers often complain about. Still they were homes, and maybe to some extent this explains why people in that income bracket now have to live on the street or in their cars or in campers parked in someone’s driveway.
I’m posting these here as part of a bigger conversation somewhere else. The stats are not 100% accurate as many builders buy their low end teardowns off market and many high end homes are custom built or sold outside of the normal listing system. But given what we have to work with…this is a tale that deserves an in depth study. Clearly those reaching out for solutions to the Homeless Problem should be armed with some data like this showing prices have not only gone up…large numbers of people have been displaced. This doesn’t even count the number of apartments that tossed out all the renters and converted to condos since 2004. Just a huge change in the name of progress.
I have to admit I was dumbfounded by all of the angst against the Tech Companies in recent times…but looking at this data, well it all makes a lot more sense. Doesn’t it?
(Required Disclosure: Stats in this Post are not Published, Verified or Compiled by The Northwest Multiple Listing Service.)
Another reason I have been working on Stats is because the DOW just went up over the January 26, 2018 Peak and so is technically out of the Correction Phase. Median Home Prices should reflect a 10% to 20% downward adjustment from the 2018 peak by year end. But looking at where we are…that’s not going to help much. Is it?