
Early Friday evening one of my favorite long term clients asked me this question: “Why is the market so slow these days? I have an alert for ($) houses in (zip code) and I barely get a couple of hits every week west of (the freeway). Almost always tear-downs.” (actual specifics from his email removed)
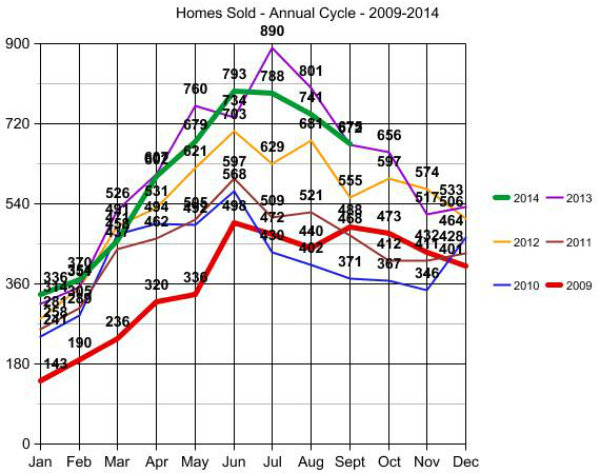
My first data set pulled was a line up the number of homes sold where I primarily work (North King County – North of I-90), by month, over the last 6 years from 2009 to 2014 YTD. This to answer only the first 8 words of his question “Why is the market so slow these days?” The easy answer would be “because it is past October 15th”. I test my knee jerk response by pulling all of the relevant data to be sure I am not answering like grandma in a rocking chair pulling some now irrelevant data from her long term memory bank. I also do this because I need to discover why this person’s current perspective may vary from the long term norm.
Something may recently have happened leading this person to believe that the standard progression is no longer the realistic expectation. I value his thought process as part of how I answer the question…by first pulling the data…lots and lots of data.
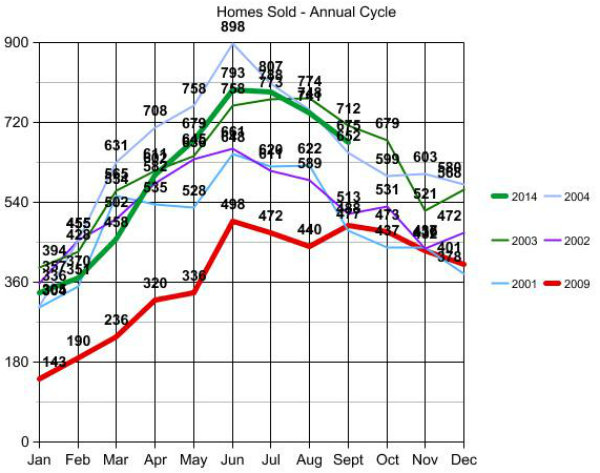
The line graph below documents the data pulled for the last 6 years. But as I almost always do when pulling stats, I went back 12 years because data expires! More on that in graphs 4 and 5. Since I almost never regurgitate already documented data from other sources, but rather only trust the data if I calculate it myself, I usually go back as far as my data source will allow, which in this case was 12 years.
First I test my perception that 2014 is not a low inventory year, even though there are tons of articles saying that inventory is low. Many articles talking about the frustration of buyers with “low inventory”. But look…no…my perception is indeed correct. The red line is the “low” or at least the first half of 2009 depicted in the red line. The green line of this year is not only NOT “low”…it is pretty close to the high over the last 6 years.
To be clear, I am using “homes worth buying” as “inventory” and the proof that they ARE homes worth buying…is someone actually bought them.
After I peruse some of the recent data as an attempt to start at the point where he may be coming from when asking the question, I dive into my own “expert opinion” perspective, which is my 2001 baseline. This information is really already carved in my brain, but since I turned 60 this year I figure it wouldn’t hurt to double check that my memory is still accurate. 🙂
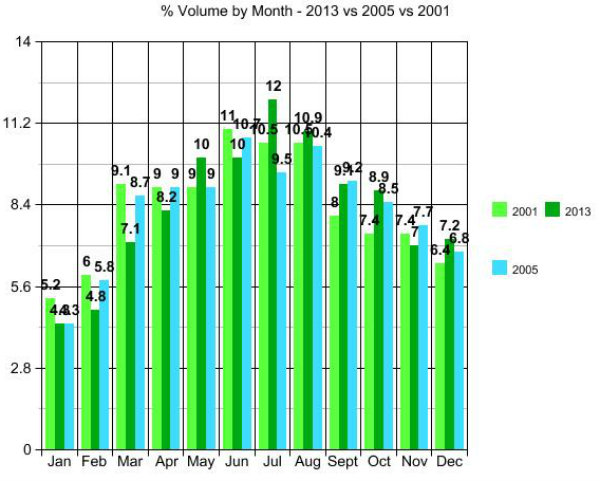
I actually did all 12 years before honing in on the actual answer to the question, which comes from comparing 2014 with 2013 and 2013 with both 2001 and 2005.
To determine which were the correct comparison years, I had to first pull ALL of the data that the data source would allow.
While yes…my knee jerk answer of “because it is October” would have been correct, by pulling all of the data I can see from the variance of the actual stats from 2013 against the baseline of 2001 exactly why the question made 100% sense from this person’s perspective at the time he asked it.
This person, along with every average homebuyer, is looking week to week over a period of 6 months to 18 months for a home to buy. They have no “baseline perspective”. Their expectations come from more recent history’s actual activity, and rightly so, with no way to tell if the last 6 months was exceeding or under performing standard market expectations.
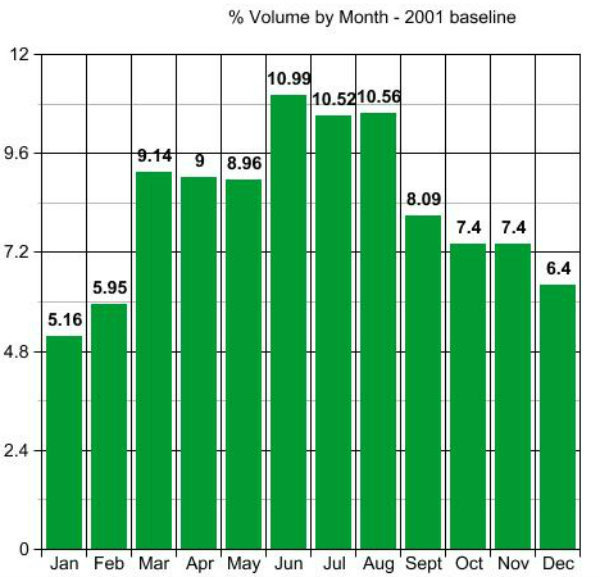
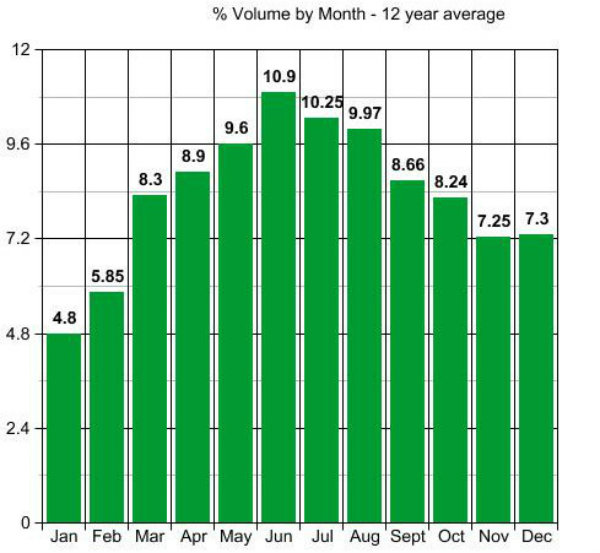
The bar graph below explains where the expectation may come from. I have 2005 in there just because it is the one year over the last 12 years when the most number of homes were purchased (ipso facto “available” to be purchased), so highest inventory year. But the key to answering the question is in the 12% of June 2013.
If you look at every piece of data on this page which looks at all 12 months for all 12 years in 6 different comparative charts…12% of a full year’s total inventory being available to buy in one 30 day period is pretty much unheard of! That was June of 2013.
I had another client who started looking in early 2013 and did not buy the house they could-should have purchased in June of 2013. After that they were progressively and continuously disappointed with the number of homes that came on market for months and months afterward. They had no way to know that the volume of homes coming on market since they started looking were many more than the normal market expectation.
In hindsight every subsequent month looked pss-poor in comparison. Pretty much all activity if you started looking in April of 2013, and didn’t purchase by June-July of 2013, is looking relatively dim. BUT in reality inventory is not dim. Inventory, the number of homes you can expect to choose from, is in fact currently performing at or over market expectations adjusted weekly for seasonality. All this can be gleaned from the 12% spike in that bar graph, noting the rational explanation as to why your expectations may be “off” by comparing relatively recent actual data against 12 years of data comparisons.
Basically that makes us both right. I’m right at “because it’s October” and the person asking the question is right to consider the options dim based on more recent relative comparison.
Posting the data and graphs that helped formulate the above. Worth noting, while I brought forward the Red Line year of 2009 to note inventory low point, the graph below shows that the 12 months of low inventory started in the 2nd half of the gold line of 2008 and proceeded to the lowest point of Jan and Feb of 2009, which some of my readers may remember as “my bottom call” that made front page news at the time.
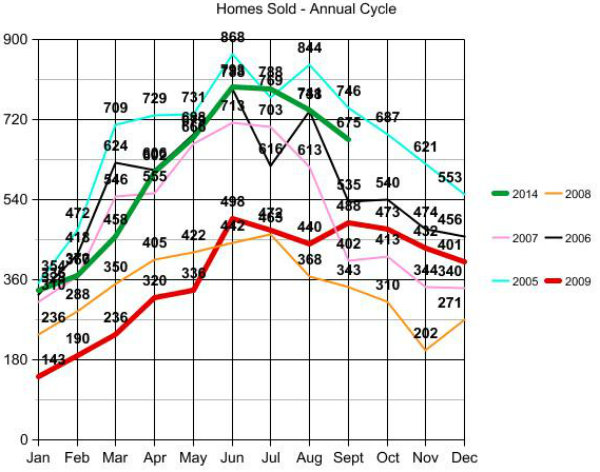
Looking above and below at the thick green line of 2014 inventory against the high inventory years of both 2004 and 2005 you can easily see why all of the articles calling 2014 low…and actually they were saying that last year in 2013 as well, are simply not true.
While my analysis will continue to use 2001 as a baseline, you may want to use the bar graph below to set your expectations. This is the average good homes on market based on the average of 12 years worth of data.
I use 2001, as many of the variances over the last 12 years are influenced by Tax Credit Incentives coming in and out and artificial interest rate jockyings…not to mention all of the massive changes in loan approval criteria over this same period. For that reason 2001 is still the purist baseline by which to compare and contrast other market influences as they come and go from time to time.
WHY IS THE MARKET SO SLOW THESE DAYS?
Getting back to the first 8 words of the original question…because based on normal seasonal activity you can expect that there will be HALF the number of homes coming on market that are worth buying by December than in May. “coming on market” activity is the month prior to the sold month. So highest SOLD volume in June will = highest number of instant alerts of new listings coming to your phone in May.
Expect the numbers to increase from December through May and then begin a decrease through year end before beginning the next climb.
WHY IS DATA THE NEW BLACK?
Because it saves you time and reduces your stress to DRILL down the data from the general comparisons above and fine tune your actual parameters before you waste any time looking for something that doesn’t exist in the place where you are looking. That brings us to the 2nd and 3rd part of this person’s question ” I have an alert for ($) houses in (zip code) and I barely get a couple of hits every week west of (the freeway). Almost always tear-downs.” (actual specifics from his email removed)”
Only 25 houses were sold using a full $150,000 spread with your $ amount as the cap in the whole 6 months of “high season”. So expecting 2 a MONTH in low season let alone 2 a week…is an invalid expectation. Expect ONE really good one a month from here to February of 2015.
“Almost always tear-downs” means you are looking for a nice home at the price of the land alone. Again an invalid expectation. Changing your price to what that home will sell for there is not an option. Changing your choice of what to a tear down is also not a reasonable option.
The only answer to your dilemma is to change the where and not the price or the what.
(Required Disclosure: Stats in this post are not compiled, verified or published by The Northwest Multiple Listing Service.)