
While my clients buy and sell in both Seattle and The Eastside, I often use The Eastside when diving deep into the stats, because the age and style of homes is easier to compartmentalize. My recent posts showing #FAIL in Bellevue, Redmond and Kirkland have raised the question “Does #FAIL = Shadow Inventory?”.
@darinpersinger on Twitter says: “I would be interested in knowing how many of those #fails were REPEAT #fails”
WaileaKid comments on the post here on RCG said: “All those red lines in the graphs above are the hopeful sellers that tried to sell in a market that they knew was falling. With the green shoots of recovery just beginning to show, these sellers will be out with a gusto. This is exactly the shadow inventory a lot of people are talking about. Looks like it will kep the prices suppressed for quite some time.”
Seattle Bubble Forum commenter, Barista, says: “Just look at all the failed attempts over this year. This looks like a huge shadow inventory to me.
Since my recent posts raised the question, seems only fair that I should answer it. For those who haven’t been following along since I started posting #FAIL stats on Christmas Eve, #FAIL = the total 2009 Expired, Cancelled and Sale Fail Release stats.
For the purpose of answering the question, I am going to use Redmond 98052 stats. These stats will not match the “Redmond” post on my blog, as I did not separate 98052 from 98053 in that “Redmond” post.
Let’s start with an overview of Redmond 98052:
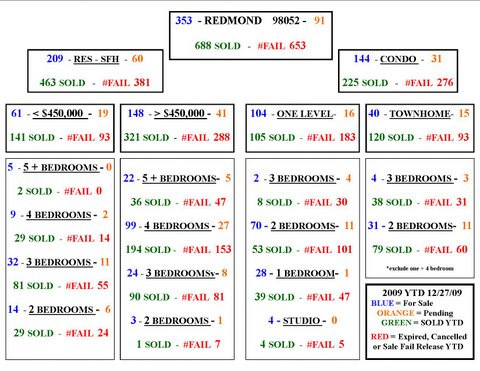
I’m going to start with 3 bedroom townhomes. Only 4 on market, 3 Pending and 38 sales year to date. Looks like a pretty strong sellers market in that group until you get to the #31 #FAILed attempts. Let’s see if there is any Shadow Inventory in there, and if so, why.
My first thought was maybe they were early in the year, but no. 14 in the first half and 17 in the 2nd half.
Going through the #FAILS one by one is tedious. I’m going to show the results for the first seven properties and then summarize. Seeing a few of the “stories” will help you judge my accuracy, as it is a subjective process. I originally had all of them listed, but it made a long post beyond reasonably long.
#FAIL #1 = Shadow Inventory.- Looks like they decided to stay when they couldn’t get their price. Plenty of equity. No mortgage. Not going to come back as a distressed sale. It was $40,000 overpriced then $30,000 overpriced, then they quit.
#FAIL #2 and #3 = Shadow Inventory – Priced well when they took it off market for the holidays. Started out $100,000 overpriced which is A LOT in this price range. Over 30% over priced. On market for well over a year, but priced properly by they time they quit. Will likely come back after the holidays. Nice place. Could use a little staging help.
#FAIL #4, #5,, #6, #7, #8, #9 This one’s been failing repeatedly. 6 of the 31 #FAIL’s for 2009 are this one townhome. Went into escrow several times and fell apart on inspection several times even though it is a newer townhome. Just a train wreck. It may be shadow inventory forever, so I’m not counting it as shadow inventory. It should be rented.
#FAIL #10 = SOLD – No big story. Started out a little high. Relisted with a 5% reduction and it sold. A “normal” #FAIL.
#FAIL #11, 12, 13, 14 (Plus 5 in 2008) This is one of those agent’s that lists for 30 days so it expires and she picks up a new listing number. It’s a SOLD now for almost $100,000 less than when it started.
#15 Overpriced = Shadow Inventory Overpriced by about $50,000 for a year with no price change. The first agent quit after 30 days, likely because they wouldn’t do a price reduction. It will be back eventually.
#FAIL #16 It was a rented property when it was listed and looks like after a half hearted attempt to sell it, they continued to rent it. I wouldn’t call it a shadow inventory unless you want to call all rented property shadow inventory.
So, to answer Darin’s question, 20 Properties Failed 31 times. So let’s call 2/3rds of #FAILS = the number of properties involved.
To answer Does #FAIL = Shadow Inventory? Of the 20 properties remaining after step number one I would say it’s about half Shadow Inventory and 25% SOLD and 25% not coming back anytime soon.
I didn’t see any that were short sales or any that could become short sales or foreclosures. Most had plenty of equity.
Going back to the chart insert anyone interested in 98052 should print that out. Lots of detailed breakdown there of everything that happened in 2009. We’ll take the 653 #Fails less 1/3 for Repeat fails of same property = 435 less 25% SOLD = 325. Maybe 250 are Shadow Inventory and the rest will stay as rentals for some time.
REQUIRED DISCLOSURE: Stats in this post are not compiled, verified or posted by The Northwest Multiple Listing Service.