About ARDELL

ARDELL is a Managing Broker with Better Properties METRO King County. ARDELL was named one of the Most Influential Real Estate Bloggers in the U.S. by Inman News and has 33+ years experience in Real Estate up and down both Coasts, representing both buyers and sellers of homes in Seattle and on The Eastside. email: ardelld@gmail.com cell: 206-910-1000

Should you sell your home?

houseFive to one, more people are asking me if they should sell their home vs. if they should buy one. That said, I have more buyer clients than seller clients. Those buyers are simply not asking IF they SHOULD buy. The most difficult scenarios are those who need to do both at the same time, who cannot buy unless they sell, and who don’t want to put their home on the market until they know where they will go if and when it sells.

I ask three questions when someone calls or emails me asking if they should sell (now).

1) Why are you thinking about selling it?

2) When did you buy it?

3) Have you “cash out” refinanced it since you bought it, and if so, when?

When you read articles like this one, and see that Seattle Area home prices are at April 2005 levels (I agree) and peaked in May of 2007 generally (I say July 2007, but close enough), it should tell you that if you purchased during that timeframe, and even between April 2005 and present, it is highly unlikley that you will be able to sell it without bringing money to closing.

Funny…no one talks much about “bringing money to closing” these days, though it happens probably at least as often as a “short sale”. Everyone assumes “upside down” homes are “short sales”, when in fact many sellers simply walk into closing with a check the same way that buyers do. Even people who are qualified to do a “short sale”, often have to bring money to closing. Just because the home sold for less than was owed, does not automatically mean that the difference was waived permanently or temporarily. Sometimes the owner pays it in full, and sometimes the owner pays it in part.

Let’s take a somewhat ludicrous example to make that point. Say the net proceeds of the sale is $500 short from covering all expenses. Likely that $500 is going to be paid by someone, and not worth going through the “short sale” process. Another example: If someone is making their payments, has $100,000 in the bank and makes $120,000 a year and is “short” $20,000, not as likely that the lienholders are going to approve a short sale. That “seller” should be bringing $20,000 to closing. This is VERY important for agents to understand as many are listing homes as short sales simply because the amount owed is in excess of current fair market value. That is NOT the only criteria to “selling short” without bringing the needed difference to closing. If the owner can choose to stay in the home if they are not approved for a short sale, if they have the means to stay and plan to stay if they are not approved, that home should really not be on the market.

Given the knowledge we have that current prices are at April 2005 levels, give or take, let’s apply that to a specific example:

Should you sell your home if you bought it in January of 2004, and are relocating with your family to another State? Let’s say it is a 2,400 sf home in Redmond in X neighborhood, for example. I see several sales in the tax records of 2,400 sf homes in that neighborhood in the 1st quarter of 2005, all selling at approximately $530,000 which is about $100,000 more than they sold for in early 2004. Cost of sale is about 8%, so let’s call expected net proceeds after sale and possible repairs at inspection at about $90,000. Always best to round down to worst case scenario. Let’s call it $75,000, because you don’t want to put your house on market with the highest of expectations. Great if you get them, but not great if you have a vacant house on market for 6 months because you “want” $90,000 net proceeds.

If you would sell it if you could walk away with $75,000 plus your down payment back, then yes you should probably sell it. One reason you might want to rent it is if you want to “leave the door open” to possibly coming back if you don’t like your new job in that new State.

If you refinanced that same house in 2007 for $650,000, then you likely want to rent it for some period if you can, so you can take the loss as a write off by turning it into a rental property vs. a primary residence before you sell it. Check with your tax accountant before putting it on market for sale.

I can’t go through a lot of examples here in the blog post, but know that:

Why are you selling it?
When did you buy it”
Did you do a cash out refinance after you bought it?

are the three most important questions to be answered, that the person who is advising you needs to know before answering the question.

If an agent says “YES! You should sell it!” without asking these questions before answering, that probably means they just want a listing so they can get buyer calls from the sign and advertising, and use your home as “inventory” to get buyer clients. 🙂

Seattle Condo Market – Lender says “more insurance mandatory”

Lenders and the condo market are still in a world of gray. No market can stabilize if the rules keep shifting faster than we can keep up with them. This frustrates both buyers and sellers, as some of these changes come into play while someone is in escrow, and the lender did not foresee the “complication”.

We are seeing this more with condo purchases than with single family homes. One of the reasons I have not done stats on the condo market for many, many months, is that all of the cards are NOT on the table with which to draw conclusions. Lenders are very, very tough on the condo market, and increasingly so.

Before I get into the “more insurance mandatory” piece of this post, I am seeing other complications with condo financing.

1) Conventional sellers wanting higher than usual downpayments and/or PMI companies refusing insurance on the difference between the down payment the lender will allow and 20% down. In the high end condos, some lenders are requiring 30% down payment if it is a condo and the resultant mortgage is a jumbo loan after the 30% down. In the lower priced condos, the lender may allow a 5% or 10% down, but the PMI won’t insure the remaining 10% or 15% to get to an 80% LTV in some cases.

2) SIGNIFICANT changes in HOA dues or special assessments caused by the “NEW RULE” that makes it mandatory for a condo association to have a Reserve Study. The net result of the reserve studies done by condos that had never before done one (some did even when it was not mandatory) is that they are finding they are grossly underfunded as to reserves. This is creating an increase in dues (in some cases double) to catch up on insufficient reserve requirements, or outright special assessments when the study points out deferred maintenance items.

BE VERY CAREFUL when valuing a condo based on “The Comps”!!! If the comps sold when the monthly dues were $185, but the dues are now $365 because a Reserve Study was done that indicated insufficient reserves, the PRICES of “the comps” need to be adjusted to compensate for the increase in dues since those condos sold.

Now to the topic of this post “Lender says: More Insurance Mandatory”. A recent comment on one of the lender posts (Rhonda’s) asked about the ability of lenders to require the buyer of a condo to have a separate policy. This additional requirement, if noted while in escrow, can cause a sale to fail if the additional unanticipated monthly amount increases the buyer’s ratios as to monthly payment outside of the pre-approved status. So VERY important.

A short history on this issue. Traditionally lenders ONLY required a copy of the Association’s Master Insurance Policy in order to close escrow on a condo purchase. The buyer of the condo was not required by the lender to have additional insurance over and above the HOA Master Policy.

Over the years I have seen the Deductible Amounts of the Association Master Policies increase from $1,000, to $5,000 to $10,000 and in some cases as high as $20,000. The Master Policy no longer covers the condo buyer and buyer’s lender as it once did due to these increases in deductible amounts. After 911 and Katrina a lot of insurance companies (due to weakened financial position generally) decided not to insure Condos at all. The number of Companies willing to provide a Master Policy to Condo developments (especially old ones built in the 70s) dwindled in some cases from 100 or more to a small handful.

Insurance premiums for same coverage and deductible skyrocketed, BUT the condo associations did not want to increase the dues that drastically. Consequently in order to reduce the insurance cost and keep dues from increasing drastically, the Boards of the Condo Associations increased the deductible in order to keep the insurance cost in line with prior year premiums.

OK…that’s the history. It has always been advisable for a condo unit buyer to get a separate personal insurance policy to supplement the Master Policy. Each Association’s Master Policy has different coverage and so I have often suggested that the condo buyer use the same insurance provider, if and when possible, and always give the Master Policy of the complex to the insurance agent to determine what supplemental insurance is needed. Covering the difference between the huge deductible on the Master Policy is a need for everyone buying a condo, in addition to covering their interior responsibility and belongings.

Apparently some lenders are now requiring this separate policy in order to fund a condo mortgage. This is hitting some lenders by surprise. Surprise is not good, ever. BUT requiring the condo buyer to have a supplemental policy IS good and this change is not only for the better…but a long, long time overdue.

To answer the question “CAN a lender require this?” Of course the answer is yes the same as they can and do require “adequate” insurance when buying a house. The only change is that “adequate” insurance with regard to condos “used to be” the Master Policy only. Now in some cases it is Master Policy PLUS unit owner Supplemental Policy, and that is as it should be IMO.

King County Home Prices 2010

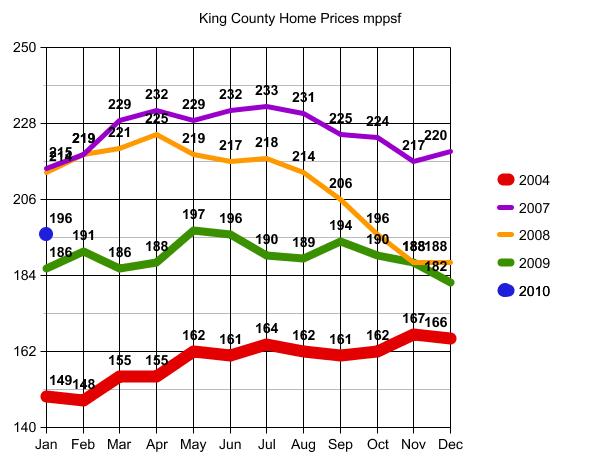
King County Home prices in 2010 will have to escape two mega foreseeable dip factors, in order to keep in the 2005 – 2006 price range. Early last year I called bottom and the end of the downward spiral, when median home price for King County was at $362,700. The year ended at at a median price of $380,000, and early closings for 2010 are running at an unsustainable high of $196 mppsf.

What to watch for in 2010:

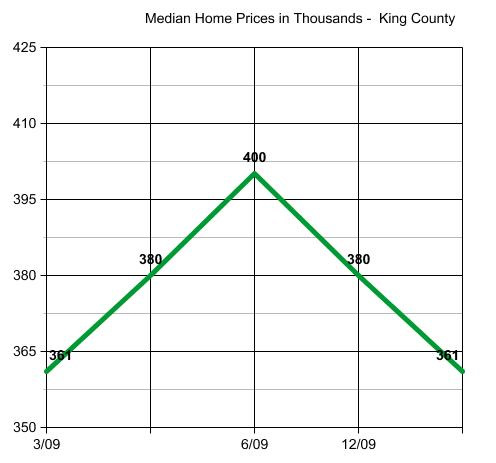
1) Prices should stay in the 5% this way or that range of $380,000. Expect a low of $361,000 to a high of $400,000. We reached that point in June of 2009 when it hit $399,000, and then backed off from there toward year end.

King County median home prices should stay within 5% of $380,000. If they move out of that range on the up or down side, it will be time to “take notice” of which way it is going out of the expected zone and why.
graph (31)

2) Even more important than staying in the 5% this way or that of $380,000 above, would be falling into 2004 price levels. Several times I have been quoted as saying that prices will maintain at 2005 levels, and so far that has been correct. We have a considerable cushion between current home prices and 2004 levels here in King County. For this graph I used median price per square foot, noting 2004 pricing as RED, the danger zone.
graph (29)

While I am still fairly confident that we will stay in 2005 – 2006 levels for the foreseeable future, I have a couple of concerns for 2010. The first, of course, is the end of the Tax Credit for Homebuyers. If we are high enough in that above $380,000 range as to median price by the time that happens, we should stay in the safe range when we take the post credit dip. If we trend down in the first quarter toward bottom, then the end of the credit will be a more worrisome event.

I am more concerned with how 2010 Assessed Values will impact home prices next year and beyond. While I agree that the County needed to back down those prices to cut back on the expensive appeal process, I see a dark cloud on the horizon. Many people have come to use County Assessed Values in some form or another when determining value and fair offer prices. The huge dip in Assessed Values from 2009 to 2010 could trigger a reaction from home buyers forcing prices into another downward spiral. We can only hope that people will look at Automated Valuation Models or “the comps”, instead of County Assessed Values. Dramatically reduced assessed values could have an unwarranted, unexpected and negative impact on home prices in the coming year. Only time will tell. That cloud may come and rain on us…or blow out to sea.

Barring a new event, look for home prices to be in the 2006 range for the strongest of neighborhoods and early 2005 range for the weakest of neighborhoods. Weakest being those with the most foreclosures and strongest being those with the least foreclosures.

East Home Prices by Style and Age of Home

North Seattle Townhome Prices by Zip Code

A Decade of Green Lake Home Prices and Sales Volume

(Required Disclosure – Stats are not compiled, verified or posted by The Northwest Multiple Listing Service)

“New on Market”? Maybe not.

The new listing numbers started out in 2010 with 3 digits vs 8 digits of the last decade and beyond. It would be awesome if we could track how many new homes are coming on market by these numbers. Unfortunately I am seeing many “new” listings on market for hundreds of days.

There is a rule against, and fine for, “trading up” your mls # from a 2009 or even 2008 listing number to a fresh 2010 one. But I am seeing many that “expired” vs. cancelled on 12/31/09 and then re-listed (often with the same agent) since 1/1/2010.

These listings are also coming up with the “n” symbol as being “new” on market. They are also showing as “on Redfin 1 day” so be sure to look at CUMULATIVE DAYS ON MARKET before determining whether or not it is really a “new” listing. You can do this on Redfin by clicking the property detail. Cumulative Days on Market seems to be “one click away” as in “on Redfin 1 day” but Cumulative days on market 455 days.

Maybe some day there will be only one mls # allowed per home address…on a 12 month rolling basis. But for now, there really are not over 3,000 “new” listings since 1/1/10, even though over 3,500 have been “newly listed” since 1/1/2010 as of today.

It’s possible that the mls will take away their “new” number, and give them back their old one. It would be great if they did, so we can track how many really new listings there are coming on market this year. So far I have not seen a way to search by “cumulative days on market”. I’ll have to ask Matt Goyer over at Redfin if they have an internal system that will do that. But if they did, I would think they would not be showing those “on Redfin 1 day” houses that have been on market for over a year.

Recommendations for a “good” Home Inspector

inspectorTrulia Voices is an excellent place to ask questions and also a good place for buyers and sellers to read other people’s questions and answers. Zillow has a similar feature, but I am not as familiar with theirs.

Today a Home Buyer in Seattle asked:

Does anyone have recommendation on a good home inspector – competent, reasonable service fee in seattle area?

The answers will likely continue to come in for days, and they are already an excellent resource for anyone looking for inspectors that are highly recommended by those who use them most often. Save the link, as these answers tend to come in for days and weeks forward from the day the question is asked.

Feel free to add your choice of inspector, either on the Trulia Voices linked questions, or the comments here on the blog.

Does #Fail = “Shadow Inventory”?

While my clients buy and sell in both Seattle and The Eastside, I often use The Eastside when diving deep into the stats, because the age and style of homes is easier to compartmentalize. My recent posts showing #FAIL in Bellevue, Redmond and Kirkland have raised the question “Does #FAIL = Shadow Inventory?”.

@darinpersinger on Twitter says: “I would be interested in knowing how many of those #fails were REPEAT #fails”

WaileaKid comments on the post here on RCG said: “All those red lines in the graphs above are the hopeful sellers that tried to sell in a market that they knew was falling. With the green shoots of recovery just beginning to show, these sellers will be out with a gusto. This is exactly the shadow inventory a lot of people are talking about. Looks like it will kep the prices suppressed for quite some time.”

Seattle Bubble Forum commenter, Barista, says: “Just look at all the failed attempts over this year. This looks like a huge shadow inventory to me.

Since my recent posts raised the question, seems only fair that I should answer it. For those who haven’t been following along since I started posting #FAIL stats on Christmas Eve, #FAIL = the total 2009 Expired, Cancelled and Sale Fail Release stats.

For the purpose of answering the question, I am going to use Redmond 98052 stats. These stats will not match the “Redmond” post on my blog, as I did not separate 98052 from 98053 in that “Redmond” post.

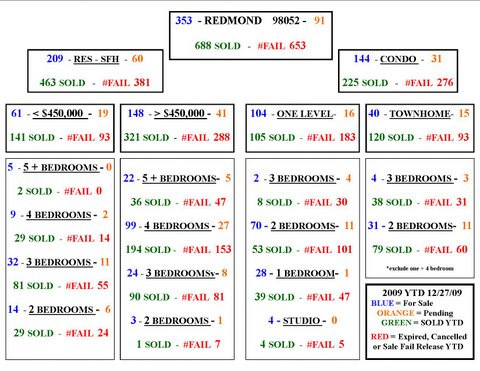
Let’s start with an overview of Redmond 98052:

98052 stats

I’m going to start with 3 bedroom townhomes. Only 4 on market, 3 Pending and 38 sales year to date. Looks like a pretty strong sellers market in that group until you get to the #31 #FAILed attempts. Let’s see if there is any Shadow Inventory in there, and if so, why.

My first thought was maybe they were early in the year, but no. 14 in the first half and 17 in the 2nd half.

Going through the #FAILS one by one is tedious. I’m going to show the results for the first seven properties and then summarize. Seeing a few of the “stories” will help you judge my accuracy, as it is a subjective process. I originally had all of them listed, but it made a long post beyond reasonably long.

#FAIL #1 = Shadow Inventory.- Looks like they decided to stay when they couldn’t get their price. Plenty of equity. No mortgage. Not going to come back as a distressed sale. It was $40,000 overpriced then $30,000 overpriced, then they quit.

#FAIL #2 and #3 = Shadow Inventory – Priced well when they took it off market for the holidays. Started out $100,000 overpriced which is A LOT in this price range. Over 30% over priced. On market for well over a year, but priced properly by they time they quit. Will likely come back after the holidays. Nice place. Could use a little staging help.

#FAIL #4, #5,, #6, #7, #8, #9 This one’s been failing repeatedly. 6 of the 31 #FAIL’s for 2009 are this one townhome. Went into escrow several times and fell apart on inspection several times even though it is a newer townhome. Just a train wreck. It may be shadow inventory forever, so I’m not counting it as shadow inventory. It should be rented.

#FAIL #10 = SOLD – No big story. Started out a little high. Relisted with a 5% reduction and it sold. A “normal” #FAIL.

#FAIL #11, 12, 13, 14 (Plus 5 in 2008) This is one of those agent’s that lists for 30 days so it expires and she picks up a new listing number. It’s a SOLD now for almost $100,000 less than when it started.

#15 Overpriced = Shadow Inventory Overpriced by about $50,000 for a year with no price change. The first agent quit after 30 days, likely because they wouldn’t do a price reduction. It will be back eventually.

#FAIL #16 It was a rented property when it was listed and looks like after a half hearted attempt to sell it, they continued to rent it. I wouldn’t call it a shadow inventory unless you want to call all rented property shadow inventory.

So, to answer Darin’s question, 20 Properties Failed 31 times. So let’s call 2/3rds of #FAILS = the number of properties involved.

To answer Does #FAIL = Shadow Inventory? Of the 20 properties remaining after step number one I would say it’s about half Shadow Inventory and 25% SOLD and 25% not coming back anytime soon.

I didn’t see any that were short sales or any that could become short sales or foreclosures. Most had plenty of equity.

Going back to the chart insert anyone interested in 98052 should print that out. Lots of detailed breakdown there of everything that happened in 2009. We’ll take the 653 #Fails less 1/3 for Repeat fails of same property = 435 less 25% SOLD = 325. Maybe 250 are Shadow Inventory and the rest will stay as rentals for some time.

REQUIRED DISCLOSURE: Stats in this post are not compiled, verified or posted by The Northwest Multiple Listing Service.

An Alternative Approach To Home Buying

Historically, a homebuyer first calculates how much home they can afford. They either do this on their own by calculating a % of their gross income, or they go to a lender who produces a home price “suitable” to their financial situation.

When you need a new coat, do you calculate how much coat you can afford? Sometimes, yes, if you are on a limited budget. But more often you simply buy one you like at a reasonable cost. Why isn’t home buying more like that? Probably because there is limited access to what “reasonable cost” is for a given area. Let’s take the time to study “reasonable cost” and also promote asking your agent this question: “Is the home I am buying a reasonable cost for this area, based on ALL homes recently SOLD here?” Remember, you are not asking for “3 comps”. You want to know how valid this price is for this particular area, generally speaking. In other words, you want to know if this is going to be a reasonable cost IF and when you have to sell the house you are buying.

When people are looking for a home to buy, they are mostly looking at homes for sale. They may look at homes that sold nearby “the comps”, but rarely do they look at a complete picture of what has sold vs. what is for sale.

Let’s look at how that may skew your perspective.
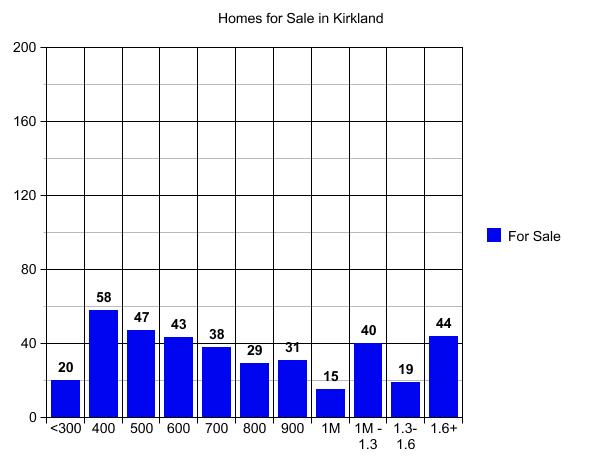
graph (14)

A quick study of price in Kirkland looking only at homes for sale at this time (graph above), would lead you to believe that the Housing Market in Kirkland is 60% or so under $800,000 and 40% or so over $800,000, with about 25% over a million dollars.

Now let’s layer in the number of homes SOLD in those price ranges in 2009 YTD (graph below). You will quickly see that 66% sold for under $600,000 vs. 60% under $800,000, and over a million is not 25%, it is more like 10% of the current “market”.
graph (15)

Now we get to the part my clients find MOST annoying about me. Let’s look at the home you are buying from the standpoint of you being the one trying to sell it. You cannot focus on a home’s weaknesses unless you can switch your mind from buyer to seller. Honestly, most of my buyer clients can’t do that no matter how hard they try, especially if they are first time buyers, and so I have to do it for them. But the visual below helps drive home the point that you may fail to sell this home you are buying today, even if you do all of the right things when it comes time to sell it.
graph (16)

There are many ways to use this information. First I’m going to ask you to look at the worst statistic in the graph above. I know most readers of this post are not in the $1.6 million plus price range. But look at this segment so that you can more easily “get” the point, and then apply it to your price range.

Green = Only 9 sales above $1.6 million

Blue = 44 people are currently trying to sell homes above $1.6 million

Red = There were 116 Failed Attempts to sell a house for over $1.6 million in 2009 YTD

IT TOOK 116 FAILED ATTEMPTS TO SELL 9 HOMES!

ONE HUNDRED AND SIXTEEN (116) FAILED ATTEMPTS IN ORDER TO GET NINE (9) N I N E homes to SOLD!

(Funny, I just checked that for the umpteenth time because it is so startling, and now there are 10 vs. 9. Still, same point.)

Sorry for yelling, but I wanted to make sure you got that point 🙂 What is a #FAIL? It’s a cancelled, expired or “Sale Fail Release”. That is not 116 properties. One of those 9 homes that sold could = 5 or more failed attempts to sell, before it actually sold.

Only the first two price segments, homes sold for $400,000 or less, had fewer failed attempts than homes sold. That’s roughly 1/3 of all homes being purchased in Kirkland. That means 2/3rds of all home buyers will likely have a difficult time selling. The degree of difficulty increases as the price increases.

You may ask “Do all agents look at the #FAIL stats?” The answer is “used to be”. Factoring in the “Failed to Sell” properties when doing a Comparative Market Analysis became a little “old school” during the hot market. Fewer properties failed to sell, and fine tuning a home valuation prior to making an offer was not standard modus operandi. I remember a new agent coming to me in 2005 asking “Where’s the button I push to tell me the home value?” I laughed; they did not. 🙂

I was trained to note “for sale” in blue, sold in “green” (real $) and Failed to Sell in Red as in STOP! But during the hot market there was no STOP sign and no brake peddle, for the most part. Newer agents were rarely if ever taught how to use the brake peddle, nor did one come with the training.

Let’s look at why that was.

In 2001 in Kirkland, 555 homes sold at $300,000 or less with 364 #Failed attempts.

In 2004 in Kirkland, 291 homes sold at $300,000 or less with only 50 #Failed attempts.

By 2006 in Kirkland only NINE (9) homes sold at $300,000 or less and only 1 #Failed attempt.

Who could train an agent how to value a property and how to consider the #Fail rate in a market like that? Why would you? So most agents who got their license in the last 5 years have a tendency to ignore the #Fail rate. Hopefully this post, in addition to assisting buyers and sellers of homes, will also suggest to a few agents that #Fail rate is immensely important to the home valuation

There is no button to push to tell you what to do with those #Fails. Valuing a home is returning to the “art form” that it once was, with subjective consideration of the #Fails. So back to the question: What is a “reasonable cost” for the area where you have chosen to buy? It’s a combination of the price paid by the majority of home buyers in that area AND the #FAIL rate for that price.

Take a look at Bellevue, for example. One of the biggest mistakes you can make in Bellevue is getting qualified at $1.5M and then trying to find the house closest to work that fits that price. You may end up with a McMansion on a busy road. A “McMansion” is not just a big house. A “McMansion” is a big house “worth” $1.5 million, stuck in the middle of an area where 90% of the homebuyers pay $500,000 give or take for a home. Perhaps taking that same house out of there and putting it in 98004 in the right location, transforms it into a home at “reasonable cost” for that area.

I’m using a somewhat ludicrous example to make a point, but buying an $800,000 home in an area where 92% of homebuyers paid $500,000 or less, can be equally “unreasonable”. Maybe not when you are buying it, but when it comes time for you to sell it.

Take a look at these graphs of Redmond. What seems to be the “reasonable cost” there? Different people will look at that same chart and answer it differently. About half the people paid $500,000 or less. If you only want a new house, you may work up the graph to only include homes built since 2003 or so. But do your homework. Work up a graph and don’t stop at “homes for sale” as shown in the first graph in this post.

An Alternative Approach To Home Buying may be deciding WHERE you would like to live, and then paying a “reasonable cost” for that area, even if that price is much less than you “can afford”.

When you need a new fleece hoodie, it really doesn’t matter that you can afford to pay $5,000 for it, does it? You’re still probably going to pay about $100 or less for it. If you look hard enough you can probably find a fleece hoodie for $5,000, or get someone to custom make it for you. But why would you?

Required Disclosure: Stats in this post are not compiled, verified or posted by The Northwest Multiple Listing Service.

The “Never Ending” Homebuyer Tax Credit

Do you only have until April 30, 2010 to get into a binding contract on a house, in order to collect your $8,000 “1st time homebuyer credit” or your $6,500 Homebuyer Credit? Lots of discussion going around about that. Some say the credit is never, ever going to go away. I find that hard to believe…unless.

When someone buys a house, they seem to be more focused on getting $8,000 than they are about the mortgage interest and real estate tax annual deduction on their income tax return. What do you think about eliminating the long term benefits of these write offs, in favor of ONLY a one time up front credit? No annual Mortgage Interest Deduction. No annual Real Estate Taxes paid deduction. Just a one time up front cash back for buying a principal residence?

Seems to me the government can recoup all of the money spent on the up front credits and then some, by eliminating the long term write offs in exchange. Of course homes purchased prior to the change would have to be grandfathered and only homes purchased after X date would get the up front vs. the long term tax benefit. Maybe they could give the homebuyer the choice of which they want. A one time election in the year you purchase the house?

Unless the government is taking something away in exchange, I really see no basis for the Homebuyer Credits being extended ad infinitum. Your thoughts?