VERY “Walkable”…but is it SAFE to walk there?

walkscoreI am very happy to report yesterday’s news that WalkScore has added a crime overlay, something I have been asking for since WalkScore first came about.

Local residents often roll their eyes when they see an awesome walk score attached to an area where it is simply not very safe to walk after dark AT ALL. Not a big problem for local residents, but what about the many people relocating to The Seattle Area who are relying on various internet tools to guide them in their search for a home in their new City?

I have not tried the new tool out extensively, but from what I have seen the crime grade does NOT reduce the walk SCORE, so a previous score of 87 will still be a score of 87. BUT if you take the time to study the color coded crime map after viewing the score, you will be better able to judge an area now than ever before. Previous to this change I have always recommended that people use Homefacts.com to pull the crime data and photos of local registered sex offenders. Not sure if the changes to walk score will replace that need or not, but I am very happy to see that they are finally acknowledging that some very “walkable” neighborhoods as to their scoring…are in reality sometimes not very safe to walk in at all.

Try it out, as I will, and let me know what you think.

Where Should I Live?

Not every client asks me where they SHOULD live. But the question comes up from time to time, and often from family members who are considering jobs in more than one city.

I am answering a more complex one for a family member who hopes to purchase a home vs rent. Scenario is they are graduating with an RN and looking at:

Los Angeles $82,000 Salary
Seattle $74,000 Salary
Colorado $71,000 Salary

The issue when people ask me is usually whether or not the salary differential makes up for the difference in the cost of the housing in various places. The offered salary is $11,000 more in Los Angeles than in Colorado, but does that compensate sufficiently for the difference in housing cost? In the past the scenarios presented to me were about renting vs buying, and often the differential did make up for that difference in rental cost. But when someone is buying vs renting…not necessarily the case.

In this particular example I am looking at Entry Level housing, VA Loan with zero down and a family that already has two children and is planning to have more children. So I need at least 3 bedrooms on this entry level housing.

Starting with “Seattle”…I know that the person is interested in The Eastside Cities of Kirkland, Bellevue or Redmond. For this “entry level” example, I am going to use a home that closed on Wednesday for one of my buyer clients BUT putting in the loan scenario of the family member of mine who is asking the question.
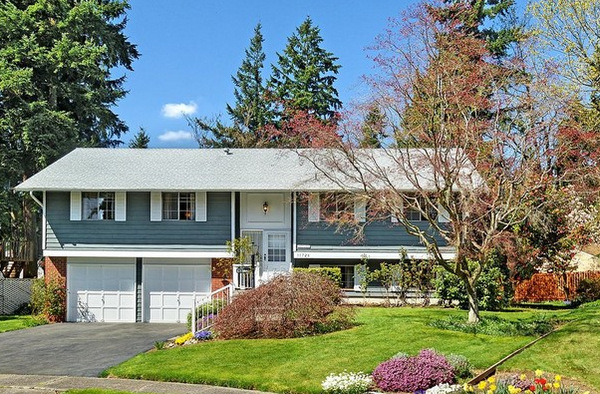
141st House

Price SOLD is $355,000. Plenty of space and yard for a growing family. Cul de sac lot. Could use some updating, but no expensive fixes needed. Had one owner for 44 years since it was built, in 1967. A good indication that a family can live there indefinitely without needing to upgrade to a larger home.

Now we’re matching this home purchase up to the above RN Salary for “Seattle” of $74,000 for the person asking the question, vs the person who actually bought it the other day.

First we’ll use the “rule of thumb” of 3 to 4 times annual income for the loan amount. That would put the loan, based on $74,000 Annual Income, at $222,000 to $296,000. A little short based on Zero Down for this home.

I’m going to move this WA scenario over to a home I sold in Mt. Lake Terrace that is a similar home, big lot, with a one car vs two car garage, but that sold for $250,000 vs $355,000. Edmonds School District. A reasonable example for Mt. Lake Terrace or Brier.
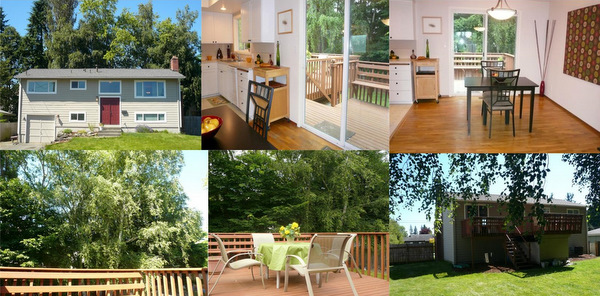
$250,000

Now we go back to our 3X to 4X Gross Annual Income “rule of thumb”. and we can fit $250,000 into that $222,000 to $296,000 equation without approaching the upper limit. NEXT we go into the actual real detail of payments, which isn’t worth doing if the Rule of Thumb = No Way, Jose.

Conservative numbers put monthly housing payment, whether that be rent or mortgage payment, at 28% of MONTHLY GROSS income. VA guidelines are usually 40/40 ratios, allowing people with no debt to put the entire debt budget on home. This Family is a Zero Down…but also a Zero Debt, so they can go somewhere between 28% and 40% as the housing payment.

I am not a Lender…so you have to check the ratios with an actual lender before making offers, but since I don’t recommend going to 40% on housing payment even if you have no debt…as you may incur debt at a later point, let’s proceed.

This family would have ZERO Closing Costs on the above $250,000 scenario as they can be included in the price with a Seller and/or Agent Credit to cover the Closing Costs entirely. So we don’t have to factor in Closing Costs on the WA scenario. That will change for the other cities.

Rates are very low today…too low to use for this scenario, so I’m going to pump the rate up to 3.75%. We are going to stack the VA Funding Fee on top of the price for Loan Amount and Payment purposes. That amount is $5,375. It can be fully or partially paid as part of the Closing Costs, but let’s assume a stack on this one taking the Loan Amount up from $250,000 to $255,375 at 3.75% is . Property Taxes are $250 a month. Homeowner’s Insurance is $50 a month.

NOTE: There are different VA Funding Fee rates for different scenarios. Putting 5% vs ZERO down can reduce the Funding Fee by almost 2%. I have used a rough scenario based on the person who asked the question. These Funding Fee rules change from time to time, are different for Refinance vs Purchase Loans, whether you were in Regular Military or National Guard and whether it is a 1st time or subsequent use of the privelege. See your local lender for specifics.

OK…back to the payment on the $255,350 Loan Amount at 3.75%. $1,182.57 for the Principal and Interest plus $250 for RE Taxes plus $50 for Home Insurance (Fire, etc.) gives us a monthly payment of 1,482.57. That happens to be pretty close to what the home would rent for, probably less than rent for this style of home in other nearby places like North Seattle or Lake Washington vs Edmonds School District. Not sure about Northshore School District, which would also be in the mix as to Bothell homes. But all in all, a good basic scenario.

Back to $74,000 Salary in WA and $1,482.57 a month housing payment. $74,000 Annual Gross Income divided by 12 gives us $6,166.67 Gross Monthly Income which puts $1,482.57 a monthly PITA at 24% of gross. At 40% of Gross Income the monthly housing allowance would be substantially more at $2,466.67. $2000 a month PITA would be a loan amount of $430,000. hmmmm.

Let’s go back to the Rule of Thumb. $430,000 is 5.81 X Annual Income vs 3 to 4 times Annual Income. Low Interest Rates do impact this rule of thumb issue, but still…going over 4X Annual Income just doesn’t look right.

Let’s go back to the first house at $350,000. That payment would be $1,679.41 plus taxes of $330 a month plus insurance of $75 a month would be $2,084.41 a month or 34% of monthly gross income. That’s really enough to spend on housing, and likely appropriate in this case as we are only using one income at an entry level salary. So the payment will become more affordable with some supplemental income from the other spouse and future raises.

So let’s say either of the above examples will work…as well as something in between.

That’s the hard part. Now let’s throw up a $250,000 home and a $350,000 home in Colorado in the Cities of preference as noted by the person asking the question.

Most Every Home in Parker Colorado fits the bill. No problem there. So Parker Colorado, even at a few thousand less in Salary down from $74,000 in WA to $71,000 in Colorado…very easy to get a house for $300,000 give or take.

This big 5 bedroom, 3,200 sf home in Parker is listed at $314,900 and there are plenty of others to choose from. Easy to see why Parker Colorado made the list of options.
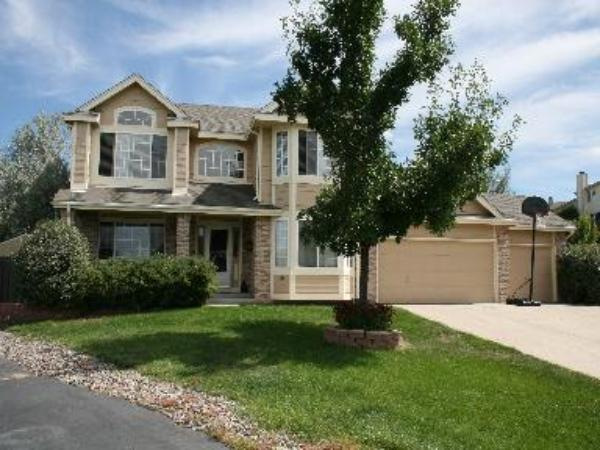
Parker

Castle Rock, another choice in Colorado, is even lower priced. This new 3,530 sf new home is listed at $288,000. But Parker doesn’t seem so far out of the way, and is plenty affordable.
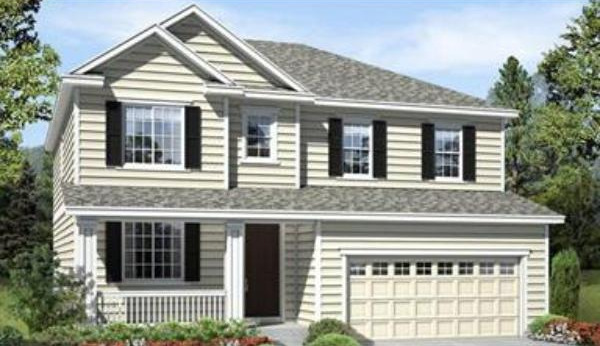
Castle Rock

That’s all I can say about Parker and Castle Rock Colorado, as I don’t know the area at all. It works, so it would depend on the salary offers in the various locations. WA works. Colorado works. Now to L.A.

We have a bit more room here, as the salaries are higher by $10,000 or so as the average. Using the same 34% of Gross I used above vs the 40% allowance, and using $82,000 as Gross income is $2,325 for housing payment. Let’s use $1,900 after taxes and insurance. That gives us a home price of $400,000 allowing the extra $10,000 for VA Funding fee on top of the mortgage.

What does that buy in L.A. in the specific areas of interest?

It doesn’t buy us anything in Walteria, one of my favorite not too Ritzy places. 🙁

It doesn’t buy us anything in Redondo Beach, even when I throw in 3 bedroom condo-townhomes.

There are a few in NW Torrance that would work, but they are short sales, so not sure if that price is reflective of “the going rate” for the area.

This 3 bedroom 2 bath, 1,468 sf home at $365,000

This house looks nice, but you can see a huge electrical tower behind the house.

Obviously L.A. is not as doable as WA or CO, so the salary difference would have to be higher. If the salary offer in L.A. was double that of WA and CO…well we can revisit this. But for a small difference…may not be worth it.

Let’s find an L.A. house and work the salary backward.

Well…I can’t find any for sale BUT the GOOD NEWS is I did find a few in Redondo Beach that SOLD. So the answer is there are a few…but the sell very quickly.

This one sold for $419,000. It’s only 914 sf though. 3 bedroom, 1 bath, but small. Nice sized lot and yard though…and it is warm and sunny enough to be outside most of the time year-round, unlike WA and CO.
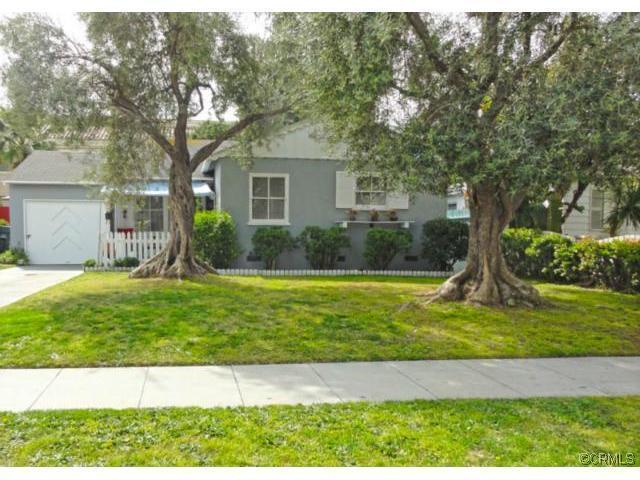
Redondo Beach

This 3 on a lot sold for $410,000. Nice Street. 1,612 sf with 3 bedrooms and 2.5 baths.

BOTTOM LINE: All three are potentially doable…enough so to put out resumes in all three areas and see what kind of offers come in. WA is probably the best option for several reasons. L.A. is doable IF the salary offered is high enough…OR…if you rent for a bit until the salary improves by raises. Parker vs Castle Rock is probably an excellent option. Depends on how close to the actual work site they would be.

The purpose of answering the question “Where Should I Live?” is not to really answer the question, but to give some food for thought. There are some other considerations like schools and safety, but I already know the not Colorado options well enough to factor that in and the Colorado Cities seem to have pretty much ALL good schools. There are a couple of exceptions in Castle Rock, and I still prefer Parker for several reasons, but most Castle Rock Schools are pretty darned good except for one or two.

Shooting this link to the person who asked the question. Hope it helped someone else with the general “thought process” and work through format. No matter where your thoughts travel as to “Where Should I Live?”, it’s not to hard to do a comparison based on Salary Differences and Home Price differences. The cheapest homes are not always the best choice…nor is the highest salary.

Of course I’d have to say WA vs CO, but to compete, I’d have to throw in a nice looking house for $350,000 in Duvall. 🙂
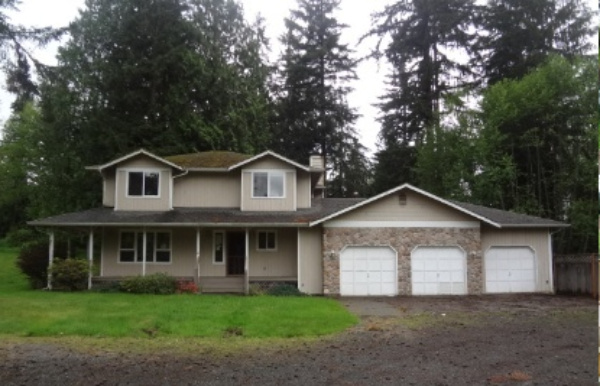
duvall

Warning: School Rankings Just Went Whacko!

schoolMany parents or “to be” parents use School Rankings as part of their Home Search Process, and I generally support that wholeheartedly. BUT something is amiss!

I don’t know what just happened. Possibly a new set of test scores just came out? The lineup of schools on most School Rating sites just shifted, and the results are staggeringly “off”. One is always forewarned about using these sites as indicators of a school’s net worth, or an indication that your child will get a better education. But usually they follow the sequence from high to low that blends with the overall frame work of areas and home prices and long term supports for what I call “the lineup” of “Best Schools”.

But for some reason, one of the long term lowest ranked schools just jumped up to highest. Usually the top 1 to 5 schools stay in “a pack” and move around. One year one is “the top school” and then it moves to 2nd place. 3rd can jump to first…and so on.

The 10th ranked school RARELY jumps from tenth to first overnight! I’ve never seen that happen before, and I am seeing it happen today. It could have happened in the last week or so. I don’t check them every day.

Be forewarned…something is amiss. I can’t put my finger on exactly what caused this recent change, and it is fairly overall across different schools and different ranking sites. Just be forewarned that if these sites were ever reliable and/or you have considered them to be so, and I generally have over the years, there is something rotten in Denmark at the moment.

I strongly suggest you not use them in your home search process until we can figure out what the heck just happened.

Should you buy a New home or an Old one?

Education Hill RedmondLots of people want a NEW Construction home, the same way they want a new car vs a used car. However starting the home buying process at “I want NEW” is just as wrong as starting the home buying process at “I want a foreclosure”.
As I have said many times, in my experience more people HATE their “home”, and want to move to a different one, because of WHERE it is vs WHAT it is.

“…and underneath all is the land…” and land is a limited commodity. So where is that NEW home going to be built? Maybe…just maybe…on the wrong piece of land. The lot no one built on prior to 2011…for good reason. Even NEW(er) home will raise this issue. So if you have your heart set on a NEW home…the number one question you need to ask is:

WHY DIDN’T ANYONE BUILD A HOUSE ON THIS PIECE OF LAND BEFORE TODAY?

So many people limit their looking to the obvious and the house itself. If you are looking at new or newer construction…begin your investigations at the land that home is sitting on. Looked at one yesterday…without going to it…via Google Maps and the Stormwater Management Comprehensive Plan for that area, and the house was built on a lot IN “The Wetlands”.

Think about that for a minute. What are the various reasons a lot might be available for someone to build homes on today…that is close in to work and good schools and shopping? It’s common sense really. Especially today…after a huge building surge from 2004 to 2008…was there really a piece of land the builders didn’t find and build on during that time? Yes…a few…but not many.

IF wanting a NEW house is your goalyou would be wise to first examine the land of it…and why no one built on it before (unless it is a tear-down lot). Oddly, the one I checked that was “in the wetlands”, well…really, you have to ask yourself. How DID it get built there? Basically one is not allowed to build a house in Wetlands. Why does it not require flood insurance with drainage basins to the north, east AND south of the house?

Think you can “see” all that? Well what about too close to underground gas pipelines? Can’t see that.

My point is you are better off listing all the things you want from a neighborhood, a location and a home, without regard to AGE of home. Then…if none that have the best location are new…well, maybe NEW Construction should not be the FIRST item on your “wish list”.

Prioritize that wish list by the where…before the what in that where. It’s common sense really, isn’t it?

If it has been a Best Place to Live for 10 to 100 years…it was likely built on before yesterday.

Seattle Area – How to Choose a “Best Place To Live”

Everyone wants to live in “the best place”, but how does one determine which is the best place for them…that also fits their budget? As with most of my posts I try to include a tutorial on how to utilize the internet to assist you in choosing wisely…or at least with informed consent.

I’ve talked before about how to use the internet to determine value and offer price. Let’s take that a step further. You don’t want a Great Deal…because you live in a block with drive by shootings and a sex offender in every other house. THAT is NOT a “Great Deal”!

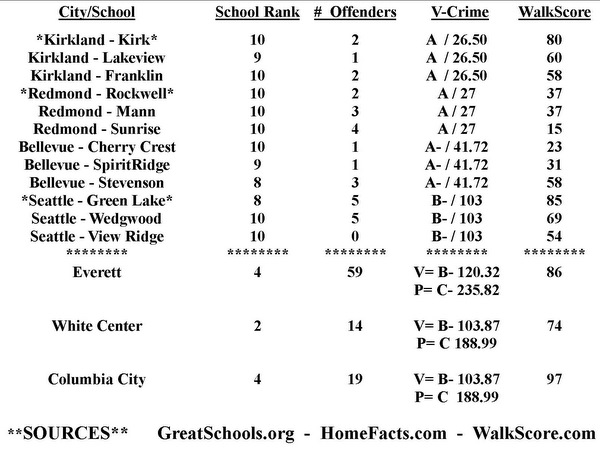
The chart below is based on a one mile radius of a given address in each area mentioned. The sources of the data are at the bottom of the chart. To make your own chart, just put in the address of the homes on your “short list”.

What you personally value or can live with is different for each person.

Some may choose a home where the school is a 4 ranking and has 59 sex offenders within a one mile radius, because they like the house. Others may settle for a split entry or a townhome in an area where there is an 8-10 ranked school and only a few sex offenders and less violent crime. Everyone is different.

I don’t think I’ve ever assisted someone in buying a home that wasn’t in the best area their money can buy, but that’s a client to client process and client decision.

If you are choosing to not use an agent at all, or to use a discounted service that does not assist with home selection, you need to fend for yourself in that regard. Using these tools and making your own chart is not infallible, but it should help to insure that if you do buy in an area of high crime…you are at least doing so with informed consent. Double check the facts…don’t take these as “verbatim”. But they should help point you in the right direction as to getting the additional facts needed.

111aaa

WalkScore is often hailed as a great site, and some RE websites even show the WalkScore next to the property data. I’m NOT a big fan of WalkScore UNLESS you look at it along with a few other available sites. I AM a big fan of choosing the most highly ranked Elementary School you can afford.

Often…though not always, the best elementary school ranking is an indicator of fewer sex offenders and lower crime. That is why you may find that homes in the best Elementary School boundary lines are more expensive. Not because of the school per se, but because of all that goes with. The reverse, lower ranked school, does not always follow the same pattern. So do your due diligence and check all the details.

Take a look at the chart above. Notice that two of the highest WalkScores also have the most sex offenders and highest Violent Crime score. (V = violent Crime / P = Property Crime) as shown on HomeFacts.com You will also see the reverse. Point being that “WalkScore” does not overlay crime statistics, as some think it does. You need to use a variety of sites and sources to get all of the information available, and not just one site.

HomeFacts will also show you the pictures and addresses of the “offenders” if you open the drop down menu. A handy site.

My “theory” has always been that the highest ranked elementary schools (that have a geographic admission boundary vs “choice” schools) will also have the lowest crime and sex offender stats. That does not mean the reverse is true. You need to pull the data as it applies to your area of interest.

The reason I use Elementary School, vs middle or high school, is it helps you grade the neighborhood on a smaller geographic base than middle or high schools that draw from a larger geographic area.

Another nifty site that I just found is NabeWise and it is no surprise to me that if I put in Seattle Metro and Safety, the two neighborhoods I choose to live in BOTH come up in the TOP EIGHT!

Using the Internet to Find a Home is not ONLY about looking at PRETTY PICTURES and then hiring a Discount Commission service to buy it. The most deeply discounted “Agent” services clearly indicated that HOME SELECTION is YOUR JOB and why you are paying a lower commission. That is not merely about “the house”.

If you are going to use the internet to save on real estate commissions…and I am all FOR that…please…use as many sites as possible to find as much information as you can, before “doing it yourself” to save on commission.

Home Prices in West Seattle – #justsayin

Viaduct to lose one lane each way in Sodo starting May 16th.

“The May 16 lane closures mark the start of a long-dreaded, long-lasting traffic slowdown to enable replacement of the 1950s-vintage highway. Conditions will remain congested until early 2016, when a tolled tunnel is to replace the central viaduct section along the waterfront.” Mike Lindblom – Seattle Times

Surprised that I am not seeing more cautionary tales about home prices that will more than likely be impacted by this issue.

Thoughts?

Curbed and Eater come to Seattle

curbed seattle

Today I excitedly Welcome Curbed and Eater to Seattle.

Curbed.com and Eater.com are well known for their fast and furious blog postings in NYC, Chicago, DC and their National Site.

I highly recommend that you bookmark both Seattle Curbed and Seattle Eater and make them part of your daily reading. Unlike other local blogs, Curbed generally has a paid staff of blog posters, so you can expect a quick flurry of relevant postings that will continue on a daily basis.

Curbed, always fun and always something new, a welcome addition to the Seattle Blogosphere!

Home Prices Recover in Kirkland 98033

Many around the Country are asking what a Home Price “Recovery” will look like and what will create it. If you have been home shopping on The Eastside close to the 520 Bridge, you are likely amazed at the strength of that market in recent weeks.

Kirkland 98033 is not the only market experiencing this phenomenon, as I first noticed the activity and price increase in the Cherry Crest neighborhood of Bellevue 98005. But since I recently represented a buyer client who closed on a home in Kirkland 98033 near Downtown in the Lakeview Elementary School area about a block from Google, I am focusing on this area first.

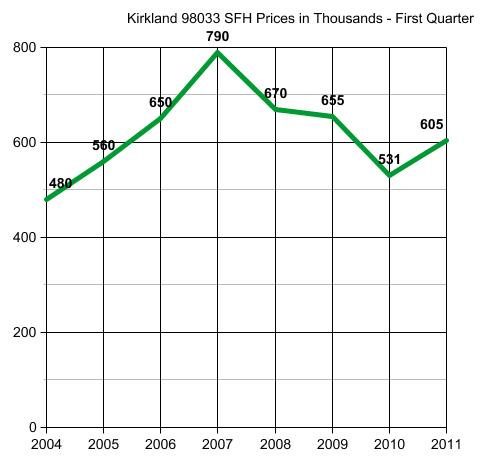
While back in October and for the 4th Quarter of 2010 we were talking about whether home prices in King County overall were running in late 2004 levels or early 2005 levels,

Kirkland 98033 has bounced up to February 2006 levels!

Before you jump to the conclusion that this segment simply had a lower % of Short Sales and Bank Owned Property…not so. A full 42% were “distressed” properties. Even with that drag of an additional 5% to 6% down created by the “distressed property sales”, the prices are running at February 2006 levels.
kirkland 2011

None of us are holding our breath for prices to reach peak levels, and I don’t anticipate that happening for many years. But if you chop off the extreme peak of 2007, home prices in 98033 are clearly recovering nicely.

WHY?

There are several contributing factors.

1) Googleopening in 98033 in late 2009 and hiring a significant number of people in recent times.

2) High Elementary School Rankings – While all of the schools in 98033 don’t enjoy the highest ranking status, those closest to Google and Downtown Kirkland do. Peter Kirk Elementary, Lakeview Elementary and Ben Franklin Elementary, all in 98033, help support and boost home values in these areas. To be fair and balanced, I did not segregate these schools in the stats and included all school areas of 98033, at least one of which ranks fairly low.

3) Anticpated 520 Bridge TollThe soon to be imposed Toll to cross the 520 Bridge has had an impact on home prices closest to that Bridge. Some have moved from Seattle over to the Eastside to avoid the Toll. Some who work on the Seattle side, but prefer Eastside Schools to Seattle Schools, have moved as close to the Bridge as possible to cut down on fuel costs and time delays to compensate for the negatives of the toll.

Kirkland is clearly one of the best places to live in the Seattle Area, and always has been, especially the area closest to it’s Downtown on the Lake. The reasons for that are many, and the subject of another post.

So yes, the Recovery is clearly “Cherry-Picking”.

A few other amazing facts. Of the 44 homes sold in the First Quarter of 2011 in 98033 that were NOT short sales or bank-owned properties, 18% sold in ONE WEEK or less with 23% selling in two weeks or less and a full 50% selling within 90 days. Clearly though the distressed properties were very high at 42%, they were not creating a huge drag on the non-distressed properties. The median for non-distressed properties was a whopping $646,000. Very close to the full median price of 2006 overall.

This is what a “Recovery” looks like. It doesn’t reach peak…but…it looks pretty darned good to homeowners in 98033.

********

(Required disclosure: Stats in this post are not compiled, verified or published by The Northwest Multiple Listing Service.)

Urban Gardening…The Seattle Way

Urban Gardening in the City of Seattle has gotten VERY creative. I’m not sure this is legal…but regardless, I think it is GREAT!!!

I’m talking about that strip of usually very ugly grass “on the street side of the pavement”. I think it technically belongs to the City and not the owner who is “gardening” there. But isn’t this awesome?

Seattle Urban Gardening

Seattle Urban Gardening

It’s supposed to(and most often does) look more like this:
DSCN0301

But look how creative this neighbor is! In that small space between the sidewalk and the street curb, they managed to grow cauliflower, cabbage, corn, sunflowers and even watermelon! Again…not sure it’s “legal”…but it’s super-awsome!
DSCN0302
DSCN0303
DSCN0304
DSCN0305
DSCN0306