Real Estate – Delusional Sellers or Delusional Buyers?

New on Market! Do you jump on it…or let it pass?

That’s really the biggest question in Real Estate today in the Seattle Area. You hate everything that is for sale, but when a house comes on that you like (and so does everyone else) how do you know whether or not you would be overpaying to be the one that buys it in less than 7 days?

Everyone’s talking about the crazy market of no one wants it or everyone wants it. C’est la vie! Knowing when to jump and when to pass is an artform in its fine points. But since everyone can’t be an artist, I try to come up with some “rules of thumb” to help you with the “pass or play” dilemma.

A few weeks back we talked about the main three steps of finding the right house using the internet. In this segment we will expand on Step 3 which helps you determine what to offer and whether or not to offer at all.

I started using a color coded system for valuation models early this year. Not necessarily to help me value property, but as a way to show others how and why an agent will walk up to one house and say “they are asking too much” and the next one “hurry and get this one before someone else does”. It’s near impossible to define that because agents tend to learn these things by osmosis vs actual data. But if you don’t know the client well, you have to find some way of conveying the “why” of that, and this is the best I could come up with for the moment.

Works fairly well if you don’t leave your common sense at home.

A for instance…I coincidentally just got an email from an agent while typing this about a “massive” 10% price reduction…and it is still WAY overpriced! How does an agent or a buyer know this instead of thinking WOW…big price drop? How do you know that it is still 20% overpriced after a 10% price drop? Well, maybe one that obvious is a secret to no one. 🙂

Back to color coding…
value color codes

Red is the universal STOP! Brown is the universal “This might be a load of crap”. Yellow is the Universal “CAUTION!”. Everything else is where most property should fall from light green to dark blue being “the norm” depending on the area and the house. Purple is reserved for Royalty, meaning the house AND the location better be pretty darned “special”.

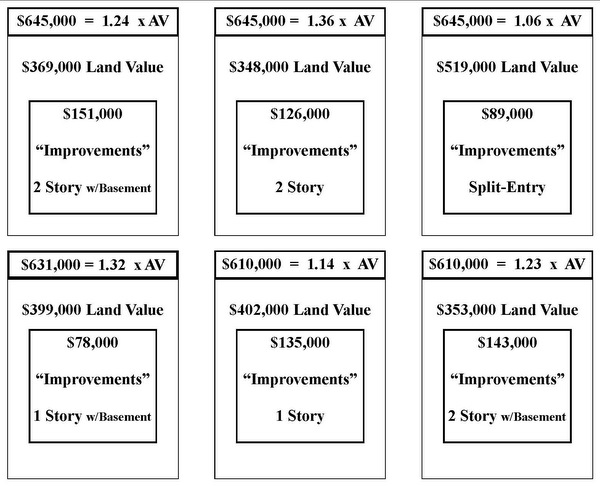
Now you chart out your area of interest noting not only the Market Value to Assessed Value Factor, but also how much of the value is represented in the DIRT of it, vs the HOUSE of it. Bring your common sense with you…the tax assessor is not always correct. Well, he/she is “correct”, but the market may not agree. So you have to adjust for market influence as to home styles, condition and changing influences on land value. Don’t make them up though…make sure you find the evidence to support your adjustments in the current data.

Your charts should look something like this for In City and most View Areas:

Lakeview 600-650

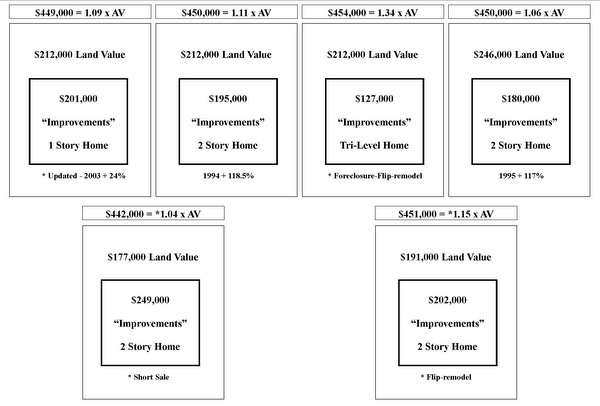
OR like this for a more typical “suburban” housing development:

98052 2011

More charts with explanations here and here and here, as you want to lay the correct ground work before working on Who is DELUSIONAL, you or the seller?

SELLER IS DELUSIONAL EXAMPLES:

I’m pulling up real examples as I type this. I can’t tell you which houses they are, because it’s against mls rules for me to shine a flashlight on delusional sellers by name and address.

1) Seller lives in the 1.1 or less area and has priced their house at FIVE TIMES the Assessed Value. Yes folks…it’s a new listing too. Lots of oddities here…let’s move on to less delusional.

2) Seller prices the house at 1.4 in the Brown Zone in an area that normally sells in the light blue zone. This is one where the Tax Assessor may be off. If you can get it into the dark blue zone, you may have to be happy with that. There’s a strong chance it will sell in the purple zone, and it should have been listed in the mid range of the purple zone at no more than 1.35 X assessed value. For my clients I’d say if you can’t get it for 1.25 X AV or less…let it pass. Why is the seller “delusional”? Because he spent a ton of money remodeling the kitchen. BUT that was 25 years ago. It needs to be done again.

3) OMG this house has been on market SO long…it must have a pile of dog poop in the living room when you walk in. How can a house be on market for almost 3 years! OK…listed at 1.28 x AV in a neighborhood that sells for 1.06. No dog poop…just overpriced. They have reduced the price over 3 years to the current 1.10 X AV…too little too late and close but no cigar. The stigma of more than 2 years on market is going to push this down into the green zone. On the bright side everyone else in the neighborhood is selling their house in 2 to 7 days, because by comparison, even though they are only priced fairly, they look like screaming deals. LOL!

4) Oh Jeez. This one is just sad. Nice house. Great house even. On market almost a year. Great area, well “good” area anyway. The problem isn’t so much that it is priced at the wrong MV to AV factor. It is priced at FIVE TIMES THE VALUE OF THE LAND! Holy Crap, Batman. a BROWN price in a GREEN neighborhood. Sad really. The only way it can ever sell is as a short sale, and that won’t likely be anytime soon. Watch for this one to go off market or be on market for 2 plus years.

5) This is a nice house on market for almost 2 years. What’s wrong with it? Switching to “Bird’s Eye View”. What the heck is that? Built between a huge condo complex and an industrial park within a stone’s throw of the freeway. The assessor knows that’s a no no, but the seller is ignoring the assessor and priced it at…wait for it…1.36 x AV and the house is in the parking lot of an industrial property! Let’s try .96 x AV on that one.

OK…enough on delusional sellers.

Let’s look at the houses that sold in less than 7 days.

1) Nice house in a 1.15 to 1.2 neighborhood but a smallish house with only one bathroom. Listed at 1.06 x AV sold the first week at full price. Maybe a little underpriced, but with only one bathroom…worked out for everyone. No surprises here.

2) A nice clean house that needs remodeling in a great neighborhood that normally sells at 1.2 x AV. Listed at 1.06 x AV. Sold in less than a week.

3) This one looks like it went too high. Obsolete home style, great staging but needs remodeling. 1.1 area. Listed at oh no…1.57 x AV RED ZONE and sold in 5 days. That should have been a pass. That’s what we call “hope you plan to die there” cause no one else is going to pay 1.57 x AV for that!

4) Here’s one in a primo Seattle neighborhood that usually sells for 1.25 x AV. Sold in 5 days at 1.23 x AV even though it was listed at 1.15 x AV. People are more likely to make the mistake of overpaying in Maple Leaf than Green Lake or in Ballard than Queen Anne, if you no what I mean. The fine nuances of value become most important in areas that border high prices, but don’t command them, like example #3 above.

I’m not going to go look for a 5th example here, but I will say that looking at all of the houses sold in even less than 7 days, hard to find any that sold over asking, and those that did were not over by a significant amount. Example #4 was likely the largest sold to asking price example.

Now let’s not forget about the Delusional Buyers.

1) Walk into the nicest remodeled house in a neighborhood that sells easily at 1.2 x AV on a bad day and want to get the house for .80 x AV. Then they complain there are no good houses for sale “at a good price”. Do your homework. Check every sold property in the last 3-6 months and chart everything. IF the areas sells for .80, like parts of Duvall, well…I have it labled yellow for “caution”. You probably want a 1.2 for 1.1 or a 1.1 for 1 or even a 1.1 for .95 if you can get it. I did a 1.1 for .85, but we did proceed with caution…and a structural engineer as well, and that was Winter. Learn to “look a gift horse in the mouth” when appropriate.

2) Wants to pay the same price per square foot of all of the sales he didn’t want to buy…for the house he does want to buy. If you didn’t like them, you already know they were worth less. Don’t complain that you lost the house you finally found. Make sure you highlight on your charts the bad houses and the good houses and offer the good house factor when you find a good house. Don’t hate all the 1.1 houses and then expect to get a great house at 1.1.

Don’t leave your common sense at home. 2011 is the Battle of the Delusionals and the survival of the fittest.

Real Estate – The #1 Question

The #1 Question in Real Estate is “How Much is THIS Home Worth?”

Every single person who is buying a home or selling a home is going to ask that question. Most people doing a refinance need the answer to that question as well.

1) A home seller needs to know the highest possible price they can sell for.

2) A home buyer needs to know the lowest possible number than can “get it” for…BUT they also need to know the maximum amount they SHOULD pay for it. The answer is often not one in the same.

3) A person planning to refinance, needs to know how much an appraisal will say it is worth, which isn’t necessarily the same method of valuation used by home buyers and home sellers.

Why do you need to know that Home Prices in King County are at early 2005 levels? Because that fact should lead you to some generally true conclusions.

1) If you are a seller thinking about selling your home, and you bought it between 6/2005 and 12/2008, you would be starting from the assumption that you CAN’T GET WHAT YOU PAID FOR IT”. If you bought it in 2001 and never refinanced it, then you should be able to sell it and walk away with positive net proceeds.

2) If you are a buyer wondering what to offer against the seller’s asking price, and he is asking more than he paid for it in 2007…well…you probably need to walk away. Maybe not see that home in the first place.

3) If you are thinking about refinancing and you bought the home in 2007 with zero down, you likely can’t. So save yourself the cost of trying.

Are there exceptions? Well, only a fool says never or always. But if you think you ARE the exception, you better have a really, really good reason why.

I know…your house is different. Your neighborhood is better. REALLY? Usually not as much as you think.

A good example of the dangers of applying Home Sale Statistics improperly, is in Redmond.

The Median Home Price in Redmond is up 66% from 2001 to Present, but not THAT house. That’s why you need to know when an area is running much higher or lower than the overall County market stats, and WHY.

Overall median price in Redmond is up 66% from 2001. Based on that true fact”:

1) A seller (erroneously) lists his home at 66% more than he paid for it in 2001. The house was built in 1985. He paid $350,000 + 66% + “negotiating room” = $599,950. He lists it at the highest possible price he can “reasonably” get for it. And he wants at least $575,000. This based on an article he reads saying Median Home Price in Redmond is up 66%, which is true…but not for HIM.

2) A buyer who reads my blog sees that 66% only applies if you include homes built in or after 1990. He sees that the % increase for homes built in Redmond prior to 1990 carry a median price of 42% more than 2001, vs 66% more. So while the “lowest price” the seller will accept is $575,000, the highest price he might be willing to pay is $500,000. We’d need to test homes built in the 80’s vs ALL homes built prior to 1990 to know for sure what a “reasonable” price for that home would be.

3) A person refinancing may expect it to appraise at $580,000, using the same logic as the seller in 1) BUT the appraiser may come up with $550,000 based on “3 comps”. This assuming the “average buyer” will pay closer to what the seller wants, than what the property is actually “worth”. An appraiser only looks at what people paid recently, not whether or not those few buyers were correct in determining “price to pay”.

There’s Good Reason why The #1 Question in Real Estate is what is THIS home WORTH?”

It’s one of the hardest questions to answer correctly. Keeping up on where home prices are generally (early 2005 levels) gives you a leg up on simply “What is the seller willing to take?”. But local stats can be misleading, if you don’t take the time to take it down to Apples to Apples.

Information is of Great Value! Knowing how to apply that information…is PRICELESS.

You should NOT be buying a house if you don’t “get” this.

Why did so many people buy houses they couldn’t afford? I’m not talking about people who bought 5 houses to “FLIP”, or the cash out refinance issues. I’m talking about the basic Buy A House to Live In IT bunch who never did a cash out refinance.

Well…on 2nd thought…let’s leave those cash out refinance people in, as this “study” may explain WHY so many NEEDED to do a cash out refinance, and use their home as an ATM machine.

Let’s start with the basic MODEL and examine where everything started to go sideways.

Qualifying for Mortgage Chart

Qualifying Ratios ONLY WORK well when THE MIDDLE COLUMN is in sync.

Now that the dust has settled and we are not looking for some ONE to BLAME, let’s look at the REALITY of what, exactly, is broken…so YOU can fix it. This is about you, as a buyer of a home, as you are the only one who can proceed on the RIGHT basis. No agent or lender can sort out that middle column for you. You must make the extra effort to QUALIFY YOURSELF!

Here’s what happened, in a nutshell. EVERYONE’S BACK END WAS OUT!!!

Used to be, looking at my Chart inserted in this post, that IF YOUR DEBT PAYMENTS caused your TOTAL of housing payment + Debt to exceed the “back end allowance”, your housing allowance was REDUCED accordingly.

EXAMPLE: Housing payment $2,800 (column one) Debt + Housing $4,000 (vs the allowable $3,600 in the Chart’s middle column) equalled a REDUCTION in allowable housing payment from $2,800 to $2,400. 28% of Gross Income was ONLY the allowable amount IF your housing payment plus monthly recurring debt payments did not exceed 36% on a combined basis.

If you do not understand this up to this point, PLEASE, PLEASE ask questions as you should NOT be buying a house if you do not understand this. If you are not capable of understanding the basic accounting framework of home buying and home ownership, then do not buy a house. It really is THAT simple.

The Middle Column went out of whack when people started using their Credit Cards for Column Three items. Before ATM cards, people did not do that. Credit was for buying a home and LARGE purchases and MONEY was for buying everything else. Front End + Back End assumed that no one would buy a carton of milk or a loaf of bread on a credit card. Front End and Back End assumed that no one would use a credit card to go to a movie theater.

That said, what YOU need to do is look at your Total Credit Card debt and separate the balance into “used for LARGE purchases” vs “used for column three expenses”.

The Lenders and the Real Estate Agents really can not do that for you. So what they DID (which proved to be disastrous) was EXPAND the back end ratio to include the usage of credit cards for column three expenses. This started when people LEASED cars vs buying them. Given you did not OWN the car at the end…this shifted the car payment from a column two expense to a column three expense.

Column Two is for large PURCHASES! Leasing a car is NOT a “purchase”. Seriously…that was the EVENT that created a huge disconnect for Qualifying Ratios, combined with people not making a distinction between when they were using a Credit Card vs an ATM card for minor purchases. Going to the movies is not a LARGE PURCHASE worthy of using a Credit Card vs a Debit Card.

There’s an old saying: “One Step Forward; Two Steps Back”. What I am suggesting here is that we have taken Two Steps Forward, and need to take One Step Back. Reconstruct your Credit Card debt to LARGE purchases only. Do not buy a house until your small purchases and living expenses of Column Three are NEVER “financed”.

If you NEED to buy your food with a credit card…you should not be buying a house. It’s THAT simple.

********

Column Three went out of whack for a number of reasons, mostly related to Column Two events as noted above. The MAIN Column Three disrupt, not associated with Column Two, is about EARMARKED savings.

Used to be people had a “Christmas Club” savings account and a “Vacation Club” savings account and an Emergency Fund Savings account that was never touched except for dire emergency (and then repaid BACK into the Emergency Fund), and a Short Term savings account for “luxury items” and a Long Term Savings Account for retirement.

Buying a boat was a “luxury item” vs a “Large Purchase”. “Large Purchase was a refrigerator, a washer and dryer, a bedroom set, etc. Things you needed long term, not things you WANTED long term. You saved for a Luxury Purchase – a large item that you WANTED and you charged a NEEDED large item to spread out the payments.

Two things largely contributed to the demise of Americans saving money and saving it in an earmarked way. One was the change from the standard 5% interest bearing passbook savings account. The other was the expansion of bank charges per account, that caused people to lump their savings into one account vs earmarking it by spreading it out among several designated purpose accounts. There was never a charge for a “christmas club” or a “vacation club”, and with 5% interest, people saved for those things vs charging those things.

A third thing that changed was the ability for a homeowner to convert their non-deductible charge card interest to deductible “mortgage” interest via a “cash out” refinance to “consolidate” debt. Seemed like a financially “smart” thing to do…until your house was “upside down” and you needed to do a short sale. Ask yourself how many short sales are done to “forgive” the car loan and the student loans that were combined into their Mortgage Amount? That is a frightening thought, and not about a HOUSING Crisis at all!

Is there any hope for a true FIX? The answer is likely HIGH INTEREST RATES are needed. When interest rates are high, people save more. When interest rates are high, people put the right amount of forethought into buying a home.

For that reason I have to say that keeping interest rates low and fixing the economy all at the same time is an oxymoron. I don’t want to see interest rates go to double digits, but until interest rates are back in the 7% to 8% range, I don’t see much hope for an overall “fix”. BUT, hopefully, if you “get” what I am saying here, you can at least fix it for YOU.

Also, an up front Tax Credit to REPLACE the Mortgage Interest Deduction would go a long way to preventing homeowners from creating an Umbrella Loan for their Car and Education and other non housing related debt, in order to qualify the interest paid as a “mortgage interest” deduction.

If you understand the chart above, and keep your “back end from falling out”, you will clearly be a Giant Step ahead of most of your Peers. It’s a NEW Decade. 2011 is the year of One Step Back to Sound Principals and reliable fundamentals. Good Luck with that. If you don’t understand any part of this, please ASK!

Happy New Year!

The 2009 Version of the “same” principals

Can you modify the ratios from those in the Chart?

Half the battle is “won” when you know WHEN you are STRETCHING, and by how much.

Truliaboy Refinances His Short Sale Purchase

Truliaboy PuppyBack in early October, I wrote a brief story of a young man (whom I have dubbed as “Truliaboy”) who purchased a nice home via a short sale at 15% under the then current market value. It is a beautiful home on over an acre of land purchased for less than $300,000. With his permission I am posting this follow up story for the benefit of those who purchased “awesome deals” with little down, to show how one person was able to get rid of the Mortgage Insurance Premium via a refinance, and save a lot of money on interest as well, less than one year after his original purchase.

At time of purchase, the Annual Percentage Rate (including up front loan costs) on Truliaboy’s TIL (Federal Truth-In-Lending Disclosure Statement) was 5.336%. The recent refinance that closed last week carries an APR of 4.491%…a considerable savings. On the original 30 year loan, the Total Finance Charges for the life of the loan show as $260,169.12. On the recent refinance the new charges for the life of the loan show as $221,385.09.

Total Savings = $38,784.03.

Back to the issue of the Mortgage Insurance Premium. The Mortgage Insurance Premium on the original loan was $109 a month, and the loan amortization on the TIL included this amount for the first 9 years plus 5 months on a slightly decreasing scale. $109 a month in the first year and down to $93 a month in the final payments. By eliminating the monthly mortgage insurance premium, Truliaboy saved approximately $11,300 in monthly mortgage insurance premium payments.

His original monthly payment, including MIP, was $1,536.60. His new payment is $1,363.05. Total savings in his current monthly payment $173.55 per month.

1) If you purchased a house in the last year or two at significant savings by buying a short sale or a bank owned home with less than 20% down, you should look into the possibility of getting rid of your Mortgage Insurance Premium by refinancing your loan IF the current value is likely 20% less than your new Total Mortgage Amount.

2) Be sure to re-evaluate the Total Savings vs. the Total Cost of the New Loan AFTER the new appraisal comes in. It could cost you a few hundred dollars in “wasted” appraisal fee, but you need to be ready to pull the plug IF the new appraisal does not come in at an amount that will equal a new Loan to Value that is more favorable than your original loan. Make sure the monthly savings via reduced or eliminated Mortgage Insurance Premium (and interest savings if applicable) justify the cost of the refinance. Check your “comps” in advance as much as possible, to help determine the odds of a successful outcome.

3) Be sure to make as many LOW COST improvements to the home (if you have not already done so) to help insure a successful new appraised value. Clean and stage your home for the appraiser’s visit the same as you would for a potential homebuyer.

Part of the success lies in the fact that Truliaboy made some improvements to the home in the short time that he has owned it. The cost of the home’s improvements since time of purchase was approximately $10,000 to $12,000 BUT Truliaboy used his $8,000 First Time Homebuyer Tax Credit to make a huge dent in the cost of those improvements.

That is an AWESOME example of how to spend your $8,000 Tax Credit wisely, and parlay it into additional savings over the time you will be living in the home, by using the improved value to get rid of the PMI / MIP!!!

As in the original story, Truliaboy gets all of the credit from me for a job well done…AGAIN! Though Truliaboy continues to credit St. Joseph for his HUGE success story, I think it was a combination of factors, not the least of which was Truliaboy’s efforts that caused St. Joseph to bless him with this successful outcome.

If you were wise and lucky enough to purchase a home at considerably less than the appraised value at time of purchase in the last couple of “sub-prime crisis” years, and you bought the home with less than 20% down payment, be sure to look into the possibility of turning that “instant equity” into REAL today savings by eliminating the Mortgage Insurance Premium via a refinance.

Buying a Bank-Owned Home? Ball’s in YOUR Court!

Interestingly, the very same day that Craig wrote his post on assisting a buyer with a bank-owned purchase, I was closing on a very similar transaction.

One difference…mine closed. 🙂

It was even the same servicing company (so possibly and even probably the same bank-owner-seller), and also an FHA loan like Craig’s transaction. Two hurdles that Craig’s transaction may or may not have had was there were multiple offers (hard to win multiple offers if you are the only FHA buyer in the room) and the buyer’s lender at the last minute required that a new roof be put on the house, prior to closing, on a house that was only 14 years old.

I have to agree with Craig, it was absolutely grueling. It’s like being Ray Allen playing against the Lakers, but there is no one else on the Court except Ray!There were too many cooks in the kitchen on the seller side, and it was almost as if they wanted you to be late and wanted the transaction to fail. At the point where the buyer’s lender wanted a new roof on the house prior to closing, I honestly think the seller wanted to move to the back up buyer AND keep my client’s Earnest Money AND collect a $100 per day per diem for as many days as possible running through the Memorial Day weekend and beyond. This is why the SELLER should NEVER be ALLOWED to choose escrow! Somebody wise up and make a law about that!

Think about it. If escrow doesn’t close on time on a bank-owned…who suffers? Buyer can lose their Earnest Money. Buyer can pay $100 per day for every day that it is late (to the seller). So how can the seller be the one who chooses escrow, when the buyer is the one with so much at stake, and the seller with everything to gain if the buyer is late?

Of course my buyer clients did close. My buyer did not close on time BUT he also paid ZERO in per diem costs because I forced the seller’s hand to the point that they were in breach. This is not the first time I have done this with a bank owned, but it takes every ounce of my time and energy for days on end. You have to have your wits about you, stay on your toes, and play every single second, day after day, with the devotion of a Ray Allen or Rondo watching every single move and being always on top of your game. One false move…one split second of incorrect decision, is the difference between the client’s success and failure.

In this corner…the seller side…we have:

Agent for seller…Assistant for agent for seller…off-site transaction coordinator for agent for seller – Escrow Company chosen by seller with TWO closing agents, one working only on the seller side and one working only for the buyer side. FIVE layers before you even get near who the seller is, and the seller has at least a few people in between all those people and the actual selling entity/bank.

…and in this corner we have…ARDELL LOL! Kim and Amy helped do a few end runs on what the buyer was doing AT the house, like choosing new hardwood and getting estimates from painters, etc. I handled the contractual and escrow problems and the buyer’s lender issues…including lender wanting a roof ON the house prior to closing. Trust me, it is no easy feat to put a quality roof on quickly on someone else’s house without their permission. …and of course…then the rain came… If we were not ready to close the buyer would have lost his $10,000 Earnest Money and/or all those many days over the very long holiday weekend in per diem fees.

Like Craig, I can’t give a true blow by blow…but it closed and my buyer clients got the house at roughly $50,000 less than the house around the corner in the same neighborhood, that closed at roughly the same time. It was imperative that THIS be the house, as they maxed out at a price just short of what it would cost for all the things they wanted in a home, school and neighborhood. So a bank-owned was likely the ONLY way for them to get all of those things because of the bank-owned discount.

So yes…for many clients, buying a bank-owned is not only best…but sometimes the ONLY way for them to achieve their goal. The number one thing to remember to be successful in a bank owned transaction is The Ball Is ALWAYS In YOUR Court! You cannot wait ONE SECOND for the other side to do what they are supposed to do. You must do their work…yes they were the ones who needed an extension, but if I did not keep writing the addendums, because it was “their job” and not mine, it never would have closed! I had to do that three times. Banks NEVER answer…they never signed the extensions until it closed…pretty much at the same time.

You cannot ask…you cannot wait for them to answer…you cannot expect them to do what they are supposed to do. You have to run that ball across the Court like you are the only one in the room with the power to make it happen! You can’t worry about what’s fair and not fair…you just have to get it done and do everyone’s work , and figure out who has the authority to move it forward and who does not.

In my case the buyer also had all kinds of things besides dealing with the seller side that made it many times harder, even if it were not a bank-owned transaction. That was a bit distracting. But at the end of the day…it was all worth it, because I truly believe I could not easily find a replacement property for those clients in their price range. THAT is why you do a bank owned…because the discounted price makes it the BEST house for that client…and possibly the only one they can afford that fits their parameters. …and, of course, they also got the $8,000 tax credit on top of that. A grueling work load and struggle…but well worth it.

You don’t do it ONLY for the “bargain” of it…you do it because it is the very BEST house for them.

Similar story: Truliaboy gets his house and a puppy.

Are you “making an offer” or buying a house?

soldBuyer Beware of Real Estate “lingo”. The soft language of “making an offer” is really leading you to sign a binding contract. For some this comes as no surprise. But for others who may think they are simply making an offer, and later deciding whether or not they really want to buy the house, this is very important. If the seller signs your offer without any changes, you are in a binding contract to purchase that house.

An agent can pretty much tell what is happening when the buyer is signing the contract. That is why I think all contracts should be signed in person, in front of the agent, and not via fax or e-signing. If they are only paying attention to the offer price, signing quickly, and not asking questions about or reading the 10 or more attached pages to “the offer”, it becomes fairly evident that they are thinking they are flushing out the “true” price vs. the asking price from the seller. Not so. Another clue is if the “offeror” is asking how they get their Earnest Money back, before signing the offer. In real estate you quickly move from making an offer to actually buying THAT house, in many cases. Once the seller signs that “offer” you are quickly pushed into the queue toward closing via the escrow process that ensues.

The key is not simply to leave yourself a bunch of legal outs, but to make sure that you really ARE going to buy that house, unless new information suggests otherwise. You should not be cancelling “on inspection” because you decided not to buy the house because of the street it is on, unless you learned something new about that street (from the inspector) AFTER you made the offer. You can, but you shouldn’t. You should consider that the seller is thinking that you really do intend to buy his house, based on what you could readily see prior to making the offer. Making an offer is not really a “maybe I will buy it”. Making an offer is indicating that you ARE buying it, unless new information that was unavailable at time of offer comes forth prior to closing, and during the due diligence period of the contract.

Technically you can lose your Earnest Money if you say “I changed my mind about buying a house” when you ask to cancel “on the home inspection”. Well, let’s change that to you SHOULD lose your Earnest Money if you are cancelling merely because you changed your mind, or because you didn’t realize when you made the “offer” that you were actually agreeing to buy the house. Remember, you are causing the seller to REMOVE the home from market. You are pulling the property OFF of the public portals. You should not be doing that simply to have more time to think about whether or not your really want to buy it.

Making an offer means you want to buy that house. An offer to purchase is not intended to be used simply to prevent other offers from coming in, while you think about whether or not you want to buy that house.

How much home can you afford?

There are few things more important to me than a home buyer being able to qualify themselves, vs. taking anyone else’s word for the answer to “How Much Home Can You Afford?” Since I am a real estate agent and not a mortgage professional, I like to post a laymen’s view at least a couple of times a year on this topic. This simplistic approach should be any potential homebuyer’s first step in “the process”. I also think that any Buyer’s Agent should go through this detail with their clients before assisting them in making an offer on a house, so consider this an agent tutorial post as well.

There are many easy to use Mortgage Calculators like this one on Zillow. But just as you should know that 6 times 3 is 18 without needing to use a calculator, you should know WHY the online mortgage calculator is spitting out a number. If you know that 6 times 3 is 18, you will know if the calculator sums that out at 37, that you or it did something wrong. Same with Mortgage Calculators and Pre-Approval letters. You should know enough to know when the answer is outside of most people’s “comfort zone”.

Back to the online mortgage calculator. The first data field you need to fill out is “current combined annual income“. You need to know a few things to answer that question correctly.

1) When they say “income” they mean GROSS income, not your take-home pay.

2) If you are salaried, and make the exact same amount every paycheck, then your current salary is what goes in that data field. If any portion of your income is based on an hourly rate or a bonus for production, then your most recent income information is not usable. Unless it is a promise to pay (salary), then your “annual income” is determined by averaging your last two years worth of income AND is subject to subjective changes by the lender’s underwriter. Sometimes that happens a week before closing! So best to qualify yourself using projected, realistic potential outcomes.

If you just got a raise from $75,000 a year to $85,000 a year, and none of that $85,000 is subject to change based on hours worked or bonus income, then the full $85,000 a year goes in that box.

If you made $85,000 a year of which $60,000 is salary and $25,000 is overtime and/or bonus income, then $85,000 is NOT what you put in that box. If you had overtime and bonuses of $15,000 last year and $25,000 this year, then you add the two together and divide by 2, making your annual gross income $60,000 salary plus $20,000 of overtime and bonus pay. HOWEVER, if it is the reverse and you had $25,000 last year and $15,000 this year…not likely the lender is going to look at a figure higher than $15,000. They may impose a continued downward trend on that recent $15,000 earning vs. $25,000 the year before. In fact they could exclude it altogether as an unreliable source of income, unless your employer produces a letter guaranteeing that the overtime and bonus income will not drop below $15,000 for the next year or two.

3) “monthly child support payments” is the next line in that particular “mortgage calculator” and is the only additional income category. That doesn’t seem right at all to me. Best to contact a lender regarding all of your “other income” sources to determine which, if any, they will use. What if your child support payments are ending in 8 months? What about interest income, alimony payments, etc.? Unless you need to use these other income sources to qualify, and expect them to continue for the life of the loan, or at least for 10 years, I would suggest not including this “other” income. It will give you a “cushion” of extra monies if needed. Buy a home you can afford without these extra income considerations, if at all possible. More on this when we get to “back end ratio”.

Back to the handy but not so accurate online mortgage calculator it makes no sense to me why they would ask for HOA dues in the “income-debt” portion and then again when getting to estimated monthly payment for the new loan. In fact the whole “income and monthly debt obligations” section is poorly worded for accuracy. Once you get past income, you want to calculate your monthly “debt” payments. The most common of these are”

Car payments, Student loan payments, credit card payments, alimony or child support payments (though technically not “debt”). What you do not include are regular living expenses like utilities, gas, car insurance…all of these are not “debt’ payments.

Now skip all the way to the bottom and see the terms “front end” and “back end”. The calculator has a pre-set for 28% front end and a 36% back end. it allows you to change these pre-sets, but do not do that until you understand the numbers using the pre-sets. Assume that the pre-sets are the Average Comfort Zone for most people.

“Front-end” is your housing payment. “Back-End” is your total debt PLUS your housing payment. Old school rules work like this:

You make $10,000 a month gross at 28% = $2,800 a month for housing payment “front-end”
You make $10,000 a month gross at 36% = $3,600 a month for housing plus debt payment “back-end”.
IF your debt payments are $1,000 vs the $800 allowed, then your front end should be $2,600 vs. $2,800. $3,600 back end minus $1,000 = $2,600, so your “back end being out” reduces the amount available for housing payment by $200.
BUT that does not work in reverse. If you have NO DEBT, your housing payment stays at $2,800 and DOES NOT increase to $3,600. This based on how likely is it that you will have no debt for 30 years?

That last paragraph is the most important paragraph in this post, so take the time to understand it well.

28% front end and 36% back end has been the long term conservative approach since forever. It is also very rare that a lender will use these ratios when qualifying you for a mortgage, so YOU must do it yourself. Then when you know your payment should be $2,600 and the lender qualifies you for a payment of $3,500, you know just how much your lender is stretching you outside of conservative standards. That tells you how difficult it may be for you to actually make that payment for the next 3-5 years. A family with 4 children might only be able to spend 20% to 25% of their gross income on housing payment. A single person with a high income may be able to stretch to 33% of their gross income on housing payment. If you are a VA buyer…this is very important, as VA uses one ratio and not two (last I looked) allowing you to spend your full back end allowance on housing payment if you have no current debt.

One of the things that prompted me to write this post today was this comment I saw from a lender on Zillow:

The rules are still tightening-to a fault. Fannie Mae will soon be announcing that they are going to a 45% back end ratio and any borrower with a 620 fico score has to put down at least 20 percent. I can live with the 20 percent for a 620 fico,but the 45% back end ratio is going to make it even more difficult…

As you can see, lenders are not used to people qualifying at a conservative standard of a 36% “back end ratio” and are complaining that the rules are too tight when requiring a 45% back end ratio. OUTRAGEOUS! Remember we are using GROSS income and not net income. So 45% of your gross income on housing payment and debt is clearly NOT too “tight” of a rule.

Knowing how to qualify yourself using 28% front end and 36% back end, will help you know for yourself what monthly payment you truly can afford. Here’s my suggestion: If conservative ratios say you can afford $2,800 for a housing payment, and your lender says that number should be $3,500, test it first. If your current rent payment is $1,700, try putting $3,500 minus $1,700 in the bank every month (not on average). If you can’t put an additional $1,700 a month in the bank easily, each and every month for at least 6-9 months, don’t consider buying a house at the max your lender “says” you can afford.

In fact regardless of the ratios, it’s a very good idea for you to pretend you have that new housing payment well in advance of making an offer to purchase. Test for yourself, by banking the difference, before taking on that 30 year obligation to pay.

What’s Happening with the $8,000 homebuyer credit?

Post Updated based on Info available as of 11/5/09 – No significant changes, but a few minor ones, so if you first read this back when I wrote it on 10/29/2009, take another look at the updates.

$8,000There are a lot of rumors flying around suggesting that the $8,000 credit has been extended. While that is not the case, as nothing has been signed yet, there seems to be strong support for:

1) Extending the $8,000 credit for 1st time buyers, including people who have not owned a home for 3 years

2) An added $6,500 credit for move up buyers who have owned their current home for at least 5 consecutive years of the last 8 years. (this provision is still under heated discussion and most subject to compromise before the bill is passed.) Updated 11/5/08

3) Expansion of the income requirement to $125,000 for an individual and $250,000  $225,000 for a married couple.

4) Extension to contracts entered into by April 30, 2010 that are also closed by June 30, 2010 (before July 1, 2010)

The most credible “rumor”/story going around [IMO] is CNN Money’s “$8,000 Credit Still in Play“.

In my opinion #1 and #4 make the most sense in that it seems senseless to drop the credit at the end of “Spring Bump” vs. just before 2010 “Spring Bump”.  Closing the door on the credit on Nov. 30th never made any sense, as seasonal factors will make it appear that the credit going away is having more of an adverse affect than it really is, given November through February sales are almost always lower as to price and volume.

Cutting the cord on the credit at the end of April (end of March even better) makes perfect sense, and gives the market the opportunity to compensate during its most robust season.  If the market can transition from 1st quarter 2010 with a credit, to 2nd and 3rd quarters without a credit on a flat market basis, it will be easier to get rid of it altogether. And yes…eventually…it really must go away. I certainly hope the industry isn’t going to keep lobbying indefinitely for its continuation. That would NOT be a good thing.

While it seems that “Senator’s Have Agreed” this credit is still not signed sealed and delivered, (Update 11/5/09 at last step, needs to be signed by the President) so stay tuned for the final version as I think the wheel may still be spinning with regard to the $6,500 move up buyer credit, as well as the expansion of the  income requirements.

Starter homes you can STAY in

First Time Buyer Big Red Flag = “I plan to sell in 2 to 3 years”.

Many people are out buying homes right now because of the $8,000 1st time homebuyer credit. Unless the credit is extended, these people have until mid to late October to find a a house and get into escrow, so they can close by the deadline of November 30, 2009 (“before December 1”). My best guess is there will be a 2010 homebuyer credit, but it will be a new one with different parameters, and not merely an extension of the current one. But all we know for sure at the moment, is the homebuyer credit we have at present will expire, if you don’t close by the end of November.

The credit is not the ONLY reason people are out buying homes. The fact that you can more readily buy a “starter home” for $350,000 or less in many areas, is likely a larger part of the reason people are buying. The linked post will show you that in the current market you are almost EIGHT times more likely to find a starter home for $350,000 or less in Kirkland, Bellevue or Redmond, than you were in 2007. In Bothell and Kenmore, homes selling for $350,000 or less represent more than a full third of all homes being sold.

This market is a blessing in disguise…lots of sadness for sellers, but an opportunity for some young families to get into a starter home for less.

My caution is this:  I don’t want to hear “I will probably sell it in….”. In the data sample I used in the link above I did not include any homes with less than three bedrooms or less than 1.5 bathrooms. I’m not saying you can’t or shouldn’t move in less than 5 years, I am saying don’t buy a house that you can’t stay in for more than 5 years. When choosing a home, you should have the option to stay in the home, as many people who are suffering today and must sell their homes, are doing so because they have grown out of them.

The moment I hear someone say “this will hold us for a couple of years”, that is a big red flag! The home below was purchased by one of my clients who already had a small baby. It was purchased in a great school district in Kirkland for about $310,000 and it is not likely they will “grow out of it”…well, maybe ever.

Moral of the story: If you can’t see yourself living in the house five years from now…don’t buy it.

starter home