Sunday Night Stats – King County, Seattle and Eastside

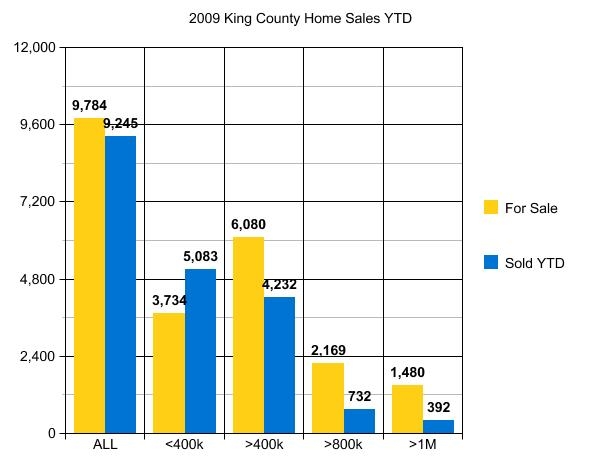
Ardell_aug-kcWhile I am not seeing any huge surprises in the market overall in King County, there were some jaw-dropping results in individual neighborhoods.
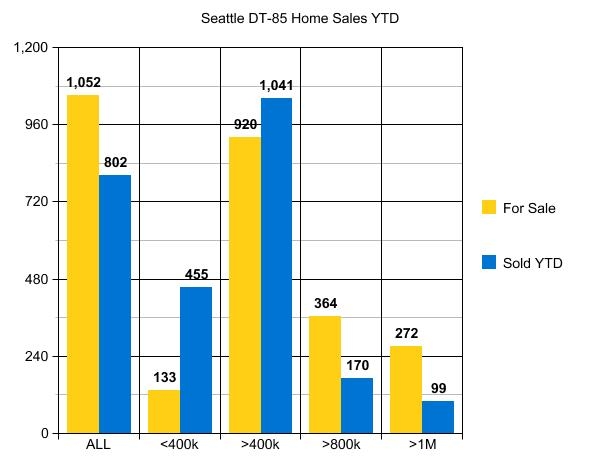
Amazingly great results from Downtown through 85th in both the first and second price tiers.

Amazingly poor results in Kirkland’s 98033 vs 98034 zip codes.  Those areas are usually reversed in terms of performance.

Redmond did not perform as well as they did last year. Bellevue only doing well in the lowest price tier.

All of King County still struggling in the over $1M market, with no exceptions.

The clear winner by far shown in the 2nd graph here, as compared to other parts of Seattle and the Eastside. Those figures of only 133 for sale in the lowest price tier, with 455 sold YTD, is beyond anyone’s wildest dreams for this market. My guess as to the dismal results for 98033 is that most of the cheapest homes used to be sold for lot value…and there are few takers for building lots and tear downs these days. The remainder of the problem is likely that homes are just overpriced, and buyers are getting much better at finding true value, vs negoatiating off of list price. This is sending the 98033 buyers into 98034 for better values and larger and nicer homes for the money.

I will be doing some in depth studies of the neighborhoods from Downtown through 85th to see if Queen Anne is outperforming Capitol Hill or if Fremont is outperforming Green Lake. Overall…as a group…clearly the best neighborhoods in terms of consistent performance which could be the hedge one is looking for against further price declines.

(Required Disclosure – The data used in this post is not compiled, verified or posted by The Northwest Multiple Listing Service. Hand calculated by ARDELL.)

Ardell_aug_dt_-_85

The Fed’s new GFE Helping to Insure Consumers Get ‘It’?

[Editor’s Note: I’m excited to publish this guest post from Adam Stein on changing role of good faith estimates. He’s a long-time local mortgage professional with Cascade Pacific Mortgage. ]

ftc screengrabThe FTC study reported on the proposed new Good Faith Estimates early on in 2005. Armed with a very thorough and unbiased study the FTC went on record, early and often, and clearly stated the FTC’s position on (then) HUD’s proposed revised Good Faith Estimate:’ DON’T DO IT!’ It seems the FTC’s findings clearly showed that consumers failed to be able to choose what loan was in their best interest when comparing rates and fees. [here’s the FTC’s Facts for Consumers: Looking for the Best Mortgage: Shop, Compare, Negotiate] So much was the confusion caused by the new Good Faith Estimate that over sixty percent of the consumers could not identify the best loan for them when comparing Good Faith Estimates generated by mortgage brokers and mortgage bankers. HUD, not to be outdone, quickly came to their own rescue with their own ‘not-so-unbiased’ study. HUD, supporting their own, quickly produced a study stating that the consumer really does understand the new disclosure (Really?).

And so the battle over RESPA reform has been waged for the better part of the last ten years. At one point the Secretary of HUD attempted to ‘slip RESPA reform under the mat’ by submitting the proposed rule just hours before Congress went on recess. Those who would have been impacted by the rule change clearly and accurately viewed this effort as ‘under handed’ as much of the required ‘commentary period’ passed by without any representative government in session to discuss the proposed RESPA reform. That effort failed in the end. The banking special interests, however, have finally figured out how to get a Good Faith Estimate through the rule making process under the guise of ‘what you can’t buy in an administration you’ll just have to do yourself’. Enter the Federal Reserve Board.

While the FRB sounds like a branch of the Federal Government it really isn’t. The Federal Reserve is a codified, private sector, coalition of the nation’s largest banks and finance companies who collaborate and advise government on key financial issues. The Federal Reserve Board also is empowered to regulate the Truth-in-Lending Act (TILA) and promulgate rules as required. Is it any wonder that the new Good Faith Estimate, vilified by the FTC for creating consumer confusion, creates a bias towards Good Faith Estimates that are generated by banks over those prepared by mortgage brokers?

My concerns are twofold: if the consumer can’t properly identify the best loan they will pay more; if mortgage brokers appear less competitive due to the disclosure of indirect compensation the mortgage broker channel will be reduced if not eliminated.

Mortgage brokers were initially the scapegoats of the ‘mortgage meltdown’. More recently, however, the broader aspects of derivatives and the role played by Wall Street and the nation’s largest investment banks have come to light. I find it ironic that now, after the creators of toxic assets have been exposed, that the FRB will promulgate rules that make their disclosures deceivingly more appealing to consumers. In the end the rule will hasten the consolidation that is already occurring in this battered real estate economy. There will be fewer choices for the consumer to choose from, moreover; when the consumers do choose their mortgage over sixty percent will choose higher rates and fees thanks to the new disclosures. Way to go FRB – You have successfully reduced, if not eliminated, competition in the mortgage marketplace and virtually guaranteed the mortgage shopping consumer will get it ‘in the end’.

Sunday Night Stats – Seattle Area Home Prices

Earlier tonight I calculated some current results comparing the Spring selling Seasons of 2005 through 2009.  The results are fairly redundant and not much changed from my bottom call back in February. I did some detailed stats for Woodinville and Greenlake-Fremont 98103, and there are not many changes or surprises. My call of 20% under peak pricing unless it is a short sale or bank-owned property, is continuing to hold, and I expect that to stay the same for at least a couple of years.

In 98103 one surprise was as to volume sold between single family homes and townhomes. With the decline in single family home prices, the volume of those sold did not decline from last year, in fact it increased slightly at the expense of townhome sales. (Caption on the graph should be 98103 Median Sold Price) and that excludes the townhomes. Towhomes are running at $338,000 vs. $429,475 for the same period last year.

I would expect prices to fall at some point doing the 4th quarter, as usual, and then next year’s Spring Bounce period to run at about the current levels.

98103

(required disclosure by NWMLS: Stats are not compiled, verified or posted by The Northwest Multiple Listing Service)

How About a ‘Disappointment Index’ for Real Estate

Tim just posted an interesting set of stats on Redfin, titled Biggest Discounts, and one of them particularly caught my eye.  His primary topic was the difference between Final Listing Price and Sold Price and how that varies by area.  But what caught my eye was the final chart that showed discounts from Original Listing Price to Final Sale Price.  This hit right on a topic I have been thinking about for some time, that I had mentally labeled the Disappointment Index.  In a very real sense, it represents the difference between what a Seller hoped to get for their home, and what they actually got after perhaps many months and many price reductions. 

Presumably a Seller, in consultation with their agent, has consciously decided what they want to ask, and get, for the property, and has some expectation that that might happen. So to the extent that they start with that expectation, then a subsequent completed sale for less is a disappointment.  And a 15% disappointment on a $500,000 house would be a big disappointment  – $75,000 not showing up in your bank account would be a very big disappointment indeed.

So here’s the question: why are these discounts so big? 

Are the agents not able to estimate market value and expected selling price any better than that?  Or are the Sellers not listening to their agents and overriding them? 

At what point does the listing agent walk away and let the Seller find a more compliant agent to list the house at a visibly above-market price?  Or does the agent take the listing and hope to work it down over a span of time, perhaps several months.  

Maybe this Disappointment Index is higher right now because both Sellers and agents are having trouble adjusting to current prices levels that are significantly lower than a year or so ago.  But it certainly does impede sales by leading to longer times on market, and lower buyer confidence in what the price really should be.

Collaboration: The important DNA in any small business

Collaboration:  Do you have this DNA in your small business?  Is it part of your mission statement or mantra?

This is not so much an insight into how a successful real estate transaction comes to fruition as much as it is a testimony of what makes any task, job, objective or goals conclude with a positive outcome.  Whether you are in the military and command a small unit of soldiers or, what I commonly describe the role of  a Realtor as,  “the Conductor

Mortgage Disclosure Improvement Act: New Waiting Periods on Mortgage Transactions

In an early post, Ardell wrote about the significance of a buyer being able to close quickly…new regulations may put a damper on that.   With mortgage applications taken after July 30, 2009, waiting periods will go into effect with regards to when and how disclosure forms are provided to the consumer.   The Mortgage Disclosure Improvement Act (MDIA), which modifies the Truth in Lending Act (TILA), was originally going to become effective on October 1, 2009, however the effective date was moved up two months which may catch some real estate professionals by surprise.

Here are some of the details:

Good Faith Estimate and Truth in Lending Disclosures….required waiting periods.

Under MDIA, early disclosures are required for “any extension of credit secured by the dwelling of the consumer.”    Three business days from application, the consumer must receive an initial Good Faith Estimate and Truth in Lending (unless the borrower is denied at application).   

The earliest a transaction can possibly close is seven days after the initial disclosures have been issued by the lender (delivered in person, mailed, emailed, etc.).    This is assuming no re-disclosure is required.

Re-disclosure (waiting periods after the early disclosure and corrected disclosures) of the GFE/TIL are triggered if the fees and charges are more than 10%; if the APR is more than 0.125% or a change in loan terms.   Three business days must pass in the event of re-disclosure.   Re-disclosing is nothing new, it typically happened at closing–this will no longer be acceptable.    Mortgage originators “should compare the APR at consummation with the APR in the most recently provided corrected disclosures (not the first set of disclosures provided) to determine whether the creditor must provide another set of corrected disclosures”.   Double check those APRs prior to doc!

From MortgageDaily.com:

“The Commentary added by the MDIA Rule expressly provides that both the seven-business-day and three-business-day waiting periods must expire for consummation to occur.  The seven-business-day waiting  period begins when the early disclosures are delivered to the consumer or placed in the mail, and not when the consumer receives the disclosures.  The three-business-day waiting periods begin when the consumer actually receives or is deemed to receive the corrected disclosures.  If corrected disclosures are mailed, the consumer is deemed to receive the disclosures three business days after mailing.  If a creditor delivers corrected disclosures via email or by a courier other than the postal service, the creditor may rely on either proof of actual receipt or the mailing rule for purposes of determining when the three-business-day waiting period begins to run.”

Consumers have the right to waive or shorten the MDIA if “a consumer determines that an extension of credit is needed to meet a bona fide perosnal financial emergency”.  

No monies may be collected from the borrower with exception to a “bona fide and reasonable” credit report fee until they receive the initial disclosures.   This may cause a delay of when an appraisal is ordered.  Most lenders require an upfront deposit to cover the cost of the appraisal.    The collection of fees rule may also cause potential issues if a borrower is doing a certain type of lock (some with float down or extended lock periods require an upfront deposit).   NOTE:  HVCC requires the borrower receive a copy of the appraisal at least three days prior to closing.

Tim Kane can attest that there is nothing worse than a borrower learning at signing their final loan papers that the fees are significantly higher than what was originally disclosed.  I’d like to think that all mortgage originators redisclosed WHEN modifications to the transaction/fees take place…obviously, this has not been the case.  

DFI covers MDIA here

Re-disclosures could become a “holy hand grenade” to quick closings.

Lower Interest Rate – Escrow Timeframe

1) How long is Escrow?

The correct answer is it can be as long or short as the buyer and seller want it to be. However a long escrow timeframe can cause an escrow to fail, because it can create a situation where the buyer no longer qualifies for the mortgage. Just because the buyer qualified when the offer was submitted, doesn’t mean the buyer will continue to qualify on the day the lender is supposed to fund the loan so the escrow can close.

A lender assumes a given interest rate when they qualify the buyer. If that interest rate is different for the reasons detailed below, at time of close, the buyer may not qualify at that changed interest rate.

2) Why do most agents write a contract to close in 30 days or less?

Dan Green of The Mortgage Reports wrote a post today explaining why a shorter escrow timeframe equals a lower mortgage interest rate. His post explains that a 60 day lock “costs more” than a 30 day lock, often in terms of higher interest rate vs. higher cash costs to close.

In order for the buyer to get the rate they think they are getting, they have to be able to lock that rate for no longer than 30 days. While the buyer is not required to lock that rate, it should at least be a possibility. If a buyer looks at a rate quote of 5%, they often are not told that assumes a rate lock period of no more than 30 days. So if they sign a contract to close in 60 days, and then try to lock the rate in the first week of their contract, they will find the rate to do that is higher than the rate they were quoted the day they made the offer.

The rate can change in a few hours without the issues noted in this post. But even if the rate does not change at all, the rate will be higher if you try to lock it through a 60 day closing vs. a 30 day closing.

The honest lender who asks “what is your proposed closing date” and gives you a “60 day lock rate quote” will be higher than the lender who assumes a 30 day lock. Be sure the lenders are using the same parameters when quoting you a rate prior to making an offer, so that you are comparing apples to apples. In this scenario the most trustworthy lender could appear to have a higher rate, when they are being most honest about the potential for rate if you lock for 60 vs. 30 days.

3) How does the closing date timeframe, chosen at time of offer AND ACCEPTANCE, impact the buyer and seller in other ways?

Buyer A gets a pre-approval letter the day they are submitting an offer. The lender pre-approves the buyer for a $300,000 mortgage at 5%.

Seller B accepts the buyer’s offer BUT asks for a 90 day closing, as the home they are moving to is new construction, and won’t be completed for 90 days.

Buyer A accepts the seller’s counter-offer as to closing date.

30 days later the buyer sees interest rates rising and wants to lock the rate. The lender quotes the “lock rate” and the buyer is confused. “I see the rate on your website is 5%. Why are you quoting me 5.25%?” Lender explains that a 60 day lock vs. a 30 day lock adds 1/4 of a % point to the mortgage interest rate.

Here’s where it gets REALLY complicated…if the buyer doesn’t qualify to buy the house if the rate is 5.25% vs. 5%, he can’t lock it. If he chooses to wait until the closing is within 30 days before he locks the rate, the rate could be at 5.5% at that time. If the timeframe for the finance contingency protecting the buyer’s Earnest Money expires prior to that time (and almost all do), the buyer is painted into a corner by circumstance.

Moral of the story is often a buyer CAN let the seller have 90 days to close if they are renting month to month. But a buyer must consider the impact of the interest rate floating out for 60 of those 90 days and/or the cost of locking for more than 30 days at time of contract.

Today, it is near impossible for a seller to stay in the property for more than 60 days from time of offer and acceptance. You can close in 30 days and let the seller stay or rent back from the buyer. BUT the buyer’s lender will not allow that seller to rent bank for an extended period. If the buyer is qualifying at an “owner occupied” interest rate, they will impose a maximum number of days that the buyer can rent it to the seller. Beyond that time period the buyer’s lender will consider it an “investment” mortgage, and higher investor interest rate and higher downpayment requirements, vs. an “owner occupied” purchase money loan.

The “ifs, ands or buts” that happen in a split second during negotiations, can change the “assumptions” made at the time the buyer received their preapproval letter. The lender is often not “in the room” while these negotiations take place, or consulted for every tiny change in close date or rent back terms. They most often don’t see those “changes” until the buyer and seller both sign the contract as finally negotiated.

These small changes can put the buyer’s Earnest Money “at risk” of loss. The agent is the “protector of the buyer’s Earnest Money”, as related to changes in contract terms during negotiations. Yet how many realize the changed position the buyer is put in when the seller counters for a longer close date?

We see thousands of articles on “How to choose an agent?” Perhaps asking the agent “what happens if the seller wants to close in 90 days, or wants to rent back for 90 days?”, is a better question than “How many homes have you ‘sold’ this year?” The cost of closing is VERY important to the buyer. Not closing at all, due to changes no one played out to the likely eventual worst case scenario, affects both the buyer AND the seller.

Agents don’t “sell” houses. Agents represent the buyer OR the seller AND the transaction as a whole, as it appears at time of offer…AND as it changes during negotiations and escrow.

Handing a contract to escrow and waiting for a commission check is no longer an option. Changes in lending BACK TO the old tried and true rules of the game, requires agents to be on their toes all the way to the day escrow closes…or doesn’t close.

Why are so many escrows not closing these days? Everyone asks that question. Truth is the skills needed by an agent have changed dramatically back to old school…and agents still think “it’s the lender’s job” vs. theirs.

Price per square foot revisited

Are formal dining rooms becoming obsolete? Are huge master suites too “selfish” for today’s changing society? Is “keeping up with the Joneses” turning into “Cutting down with the Joneses”?

In a market projected to be flat at best for the foreseeable future, these questions are fast becoming very important for each home buyer to ask and answer, each in their own way.

In the age of “me”, me being the parents vs. the children, the places where children “go” in their home got smaller and smaller. Families used to spend more time together in the “living” room until the children were banished to the “family room” and the living room became a “formal” living room that most no one ever used. People gathered in the kitchen with friends and family, until the “formal” dining room became a place and space ONLY used once in a while when “guests” came. As if the kitchen was OK for the kids, but the visitors were somehow more important, so much so that we paid big money for a special room just for “guests” vs the family on an everyday basis.

Beyond price per square foot, it is time for home buyers to determine price per square foot of WHAT? Forget about how it currently “works”. It’s time to change how it works.

First Floor = 1,630 sf of which only 534 square feet represent rooms the children enter on a regular basis. The rest is “formal” living room, “formal” dining room, “Dad’s” study, “grand” staircase and foyer. Even if you throw in the 1/2 bath, the space the children live in is smaller than the square footage of the attached 3 car garage at 660 sf.

When did the children become entitled to less space than the cars?

Second Floor = 1,260 sf of which each child’s bedroom is only 130 sf. If you have two children and throw in the bathroom they share at 5 x 8, that gives them 380 sf on the second floor. Let’s be generous and give them an open loft “bonus” room to do their homework in at 15 x 15 and you still have a full HALF of the second floor devoted to master suites and grand staircases.

2,890 sf of home plus 660 sf of garage = 3,550 sf of which only 1,165 sf is space the children enter on a regular basis. The “children’s” place is not even double the amount devoted to housing the cars. Given the “children’s” space includes the kitchen and the family room, that’s just sad.

Let’s put a price tag of $550,000 on this home = $154 per square foot including the garage. 1,165 sf times $154 = $180,500 of that $550,000 devoted to the “family” and places where the children go on a daily basis. That’s about $370,000 for formal areas, master bedrooms and baths, showy staircases and places to put the cars.

Do you really want to spend $380,000 for places your children don’t enjoy?

Put this house on a small lot, as a zero lot line home, and we have to ask ourselves: I know we’ve come a long way, we’re changing day to day. But tell me, where do the children play?

Live Video Streams on RCG? With Facebook Chat?

I’ve been told my interest in using Facebook for marketing is a bit unhealthy, but I’ve been having so much fun, and this week I pushed the limits in some ways that I thought I’d share in the hope we could spark some interesting conversations…

275x229First off, I’ve been really fortunate to work with the team behind a really interesting movie called The Stoning of Soraya M. that’s being released in selected theaters today (and Seattle on July 17th). It’s a controversial movie based on the true story of a woman who was stoned to death in the Iran after being accused of adultly adultery by her husband. To help with outreach for the movie, I built (with some ridiculously well-timed help from Loren Nason of the Future of Real Estate Technology) a Facebook app that let me combine both a live video stream with a streaming facebook chat-style app. The result was an interview with the director where we took questions from the Facebook community. You can see a recording of the video on the Spinnio app page where we hosted the conversation.

However, before I was ready to go live with the app for the movie, I decided to use the Spinnio app to record a weekly radio show that I run with Rob Hahn called the RE:RnD (Real Estate Radio with Rob and Dustin)… Normally, Rob and I record our radio show form opposite sides of the country, but this week, we were both in Orange County for REBCOC. We took advantage of some of the great real estate people in attendance to interview:

You can watch the video here:

But wait, there’s more!!!

seattle-channelI happen to think the technology of streaming video with Facebook Chat is simply too interesting to resist… so I created a page on RCG that combines the live stream from the Seattle Channel with a chat box that lets you comment on the video with anyone else on RCG watching the video. While I doubt this page will get the critical mass to be extremely interesting, hopefully you can see how cool it could be and just where the Facebook chat/status update technology is heading.

Also, I’m somewhat hesitant to throw a generic chat on RCG in a prominent place, but what do you think?

FB.init(“639647c0b027e22dfc546244ab17a875”, “files/xd_receiver.htm”);

(By the way, this works! Feel free to try it out, although be prepared that each comment leaves a “status” update on your profile.)

I’ve never liked the idea of adding a message board because I simply don’t have the time to moderate it, but I have a feeling that this would be pretty self-moderating considering it’s tied to people’s Facebook account… But what do you think? Should I create a place on RCG where you can leave comments and engage in conversations that aren’t tied to any blog post?

Are sales really “failing” to sell?

(From near the end of this post: “Looks like of the 1,081 combined pendings since 6/1/09, at least 21% are short sales. But of the 1,379 closed in 30 days, less than 2% were closed short sales.”) Read full post for more info. That indicates a HUGE failure rate on Short Sales, though some of the variance could be attributed to other factors.

It seems that since the mls removed STI (subject to inspection) as a status, more pendings are failing.  Is this partly because we are now counting the same property twice, and so only 1 closing for 2 pendings in many cases?

1) IF it is first “Pending Inspection” or “Pending Feasibility” study – Every house that is put into “pending subject to inspection” will “fall out” into “pending”, before it goes to “Closed”.

2) Likewise a large number of bank-owned sales are previous listings that may have been pending as short sales.  They DO sell, but by the bank seller vs the owner occupant seller. The house IS sold at the end of the day. We are just showing two pendings for that one sale, with one closing and the other one “failing”, due to the change of seller name from owner to bank.

The only way for us to know this is to track them differently going forward. There is no way to get prior stats of the switch out from Pending Inspection to Pending or failed short sale = closed bank-owned sale, without looking inside each transaction by hand.  Too cumbersome.  But in recent history I believe these are clearly marked and can be identified for individual study, so if we begin now, we should have some really good data as time moves forward.

Today is the first day of the rest of our…research. Let’s begin on the “right foot”.

I’m going to go to the beginning of June, assuming anything that “went Pending” on June 1 hasn’t closed yet.  We can turn it into graphs after several weeks of raw data are obtained. Sticking to “Residential Only” (which in Seattle includes townhomes and on the Eastside does not, by and large). Most stats available are for SFH, such as on Seattle Bubble, so I will exclude “condo” and other types of property. I will also exclude manufactured/mobile homes and houseboats, which may have different #fail as to finance issues.  There is also a status called “Pending BU Requested” which indicates the agent is thinking the buyer in escrow may not close and is looking for BU offers.  I am going to show them separately as they don’t “fall out” into another Pending status before going to Closed…but should indicate a higher expectancy that the sale will fail.

In future posts containing these Pending stats, I will link to this post and not repeat the parameters each time. If anyone disagrees with the parameters, speak up so we can make the changes at the beginning together.

King County: Went Pending since June 1:

Pending = 456  (PI – 499, PF – 6, PBU – 120)

Note: a property can’t have two statuses at the same time.  So the 456 “true” pendings, are not also contained in the other categories.  PI used to be STI-subject to inspection. PBU is generally reserved for properties expected not to close with the current buyer who is in escrow. PF always had a high fail rate as the buyer is saying I only want to buy it IF…”. PI and PF should eventually move to “Pending” and only counted there. PBU we will try to break down further:

89 of the 120 PBU (Pending BackUps) are noted as “Short Sales”

7 more appear to be short sales, but some with prior lienholder approval

Many of the remaining properties in PBU are also short sales, but the field is new and some are not yet using it properly, especially if the property went pending since 6/1/09 BUT was listed long before the SS field was implemented. This data should improve over time. For now note that MOST of the 120 PBUs are Short Sales.

In addition, at least 135 of the 499 Pending Inspections are Short Sales.

Closed in the last 30 days – 1,379

Best I can tell, given pendings are closing in longer and undertermined timeframes, we can’t study a relationship between recent pendings and closed sales. Unless someone has some ideas here.

But at least we can track and see if the “true and full” Pendings are increasing or decreasing, if the short sales are increasing or decreasing.

Let me check for one more thing.  How many of those closed sales were noted as Short Sales. WOW! only about 24.  There you go…as I’ve said before, A Short Sale is not necessarily for sale!

Looks like of the 1,081 of combined pendings since 6/1/09, at least 21% are short sales. But of the 1,379 closed in 30 days, less than 2% were closed short sales. I’m going to leave this here, but also bring it up to the first paragraph.

Now that you can see how we will be able to break down the stats into the future, your thoughts on meaningful arrangement of data much appreciated.

Seems to me we need to note closed since 6/1 here (451) as Pendings will drop as they are Closed.

The primary purpose of this post is to show you what data is available, so that you can request a customized format in the comments below this post. (I am going to tag this “Sunday Night Stats”, just so that tag will pull up the full year and a half of my data related posts. You can get more data in this link of Tracking the Market.)

Required disclosure Stats are not compiled, verified or posted by NWMLS

UPDATE: I am compiling median prices and price per square foot of “normal” sales vs. short sales and bank owned.  I just found a drop down vs. check box for identifying bank owned properties.  … link HERE to the additional data . Breaking it down to North King vs. South King. There is a huge variance in pricing and the distressed sales are not dragging down other property sales “to their level”. Though I do think as time goes forward, identification of distressed sales will be more and more accurate as the new required field is used often and properly from here forward.