Real Estate – “Proceeding in Good Faith”

contract
Real Estate Transactions have long depended on the underlying principle of “Proceeding in Good Faith”. It’s not something that we talk about much, as it is something we pretty much take for granted.

I raise this issue today as Craig has mentioned it a few times this year in his posts and comments, and most recently the other day in his post regarding “Good Faith Home Inspection Negotiations”.

Before we can discuss how “Proceeding in Good Faith” applies to the Home Inspection specifically, we need to discuss how “Proceeding in Good Faith” applies to all real estate transactions, generally. When we are talking about this principle in real estate, we are talking about the Buyer and the Seller who are the “Parties To” the transaction. It is not about agents except to the extent that they represent someone who is acting and proceeding in good faith. Consequently the presence or absence of real estate agents in the transaction neither heightens nor diminishes the importance of the good faith process.

Good Faith BEGINS with a seller who wants to sell and a buyer who wants to buy. One would think this is always the case, but it is not. NO ONE can PROCEED “in good faith” if these two things are not present from the getgo.

While it may be hard for some to believe, not everyone who has their home listed for sale has the intent of actually selling it (at the price at which it will actually sell), and not everyone who makes a written offer actually has the intent of buying (that particular house). Who is and who is not Proceeding in Good Faith…well, that gets a little complicated.

Buyer Says: “What’s wrong with this seller? Is he REALLY going to Let This Sale Fall Apart over a $150 fix to a leak under the sink?”

Seller Says: “Well it’s a good thing that buyer DIDN”T buy my house, He oviously did NOT want it, if he was willing to walk away from it over a $150 fix to a leak under a sink! Anyone who is not willing to fix a leak under a sink shouldn’t be a Home OWNER Period!”

Craig, in his post linked in this one says: ” As a general rule, I think “good faith

2011 FHA and VA Loan Limits for Seattle

FHA loan limits for homes located in King, Pierce and Snohomish Counties will remain the same until September 30, 2011.

  • 1 Unit – $567,500
  • 2 Unit – $726,500
  • 3 Unit – $878,150
  • 4 Unit – $1,091,350

I have the FHA loan limits for other counties in Washington posted here.   FHA still allows 3.5% down payment, which can be gifted (or loaned) by family; 5% down will provide slightly improved mortgage insurance rates.   FHA insured loans may be assumable which may be a huge benefit for future home sellers when they are able to offer today’s rate in a higher rate environment.

VA Loan Limt effective January 1, 2011 through September 30, 2011 for King, Snohomish and Pierce Counties is $500,000.   This is a slight increase from $481,250 in 2010.  Here is a list of VA loan limits for all counties in Washington.

Qualified veterans can do 100% financing up to $500,000.   If a sales price is above $500,000, the veterans down payment is 25% of the difference between the loan amount and sales price.   

For example, if a veteran purchases home in Bellevue with a sales price of $600,000; their down payment is $25,000.   600,000 – 500,000 = 100,000.  100,000 x 25% = $25,000.   

Any seller should include buyers who are using FHA or VA for financing or they are seriously limiting their potential for selling their home.

Why the Lender may “reduce” Your Gross Income

Gross Income is sometimes a subjective factor, modified at The Underwriter’s discretion. Most often that is the case whenever ANY part of the borrowers Gross Income is derived from overtime, bonus or commission, or the entire Gross Income is based on hourly wages vs salaried wages.

EVERY AGENT should understand these BASICS, as WE often know our clients longer and better than the lender who is giving you a pre-approval letter to attach to the buyer’s offer. At a minimum, every agent should know that if their client is not purely “on salary”, there may be some bumps along the way that may turn a preapproval into a loan denial.

Even if the lender did a full preapproval process, The Underwriter may require the employer to make a written statement regarding future bonus or commission or overtime income, that the employer will not put in writing. That can happen in any case, and sometimes a few days before closing, no matter how careful the loan originator was in gathering information prior to producing the preapproval letter.

AGENTS should know when the preapproval MAY be based on the “wrong facts”, especially when you are getting a preapproval letter with short notice, and the lender knows the client for 15 minutes prior to giving the agent what they need to get the offer submitted quickly. Fully delegating this responsibility to the lender is inappropriate. An agent should know when to give the lender a “heads up” that $100,000 may indeed be “current” gross income, BUT it is likely that The Underwriter at the end of the day WILL NOT count ALL of that $100,000!

Getting a mortgage is not an “entitlement”…it is a business decision. Below are examples of how Lenders have historically “viewed” Gross Income calculations in most cases. But know that The Underwriter has the discretion to modify “as needed” based on inconsistencies.

First let’s look at the basic chart I made for the purpose of further discussion:
gross income

Column One: Salaried Income is almost always counted at current “face” value. Even if you just got a significant raise just prior to making an offer on the house, the lender will usually count it all. They will require at least one and often two paystubs at the NEW amount as proof that the raise is in effect, and ALL of the monies have to be salary vs hourly or bonus or commission based.

Column Two: If your wages are based on an hourly amount, RARELY will the Lender count it at its current annual amount based on today’s hourly wage. I don’t necessarily agree that hourly based wage earners should be treated differently than salaried ones, but I don’t make “the rules”.

If your hourly rate increased from $16 an hour to $24 an hour over the last two years, you normally need A FULL TWO YEAR HISTORY of earnings at the new hourly amount of $24, for the Lender to use that as your Gross Income. If you earned $16 an hour in 2009 and $19 an hour in 2010 and you WILL BE making $24 an hour in 2011, the Lender will usually average your annual wages of 2009 and 2010 and count your income at only $16 + $19 divided by two at ONLY $17.50 an hour vs the $24 that you are now making. Terrible, but true. They actually average your total earnings (not including overtime) for the two years, vs the hourly number.

HUGELY important for an agent and a lender to know if your wages are based on an hourly amount before issuing a preapproval letter.

Again, I really don’t think that it is fair, as I have had clients with an over 20 year history with the same employer (Boeing) whose income was stated on an hourly vs salaried basis. Why that counts as “lesser” in the eyes of lenders, I don’t know. Just is, in MOST if not all cases.

I also included an odd example in Column Two of The Underwriter deciding that if your income reduced by 20% that maybe that will happen again in the future. Once The Underwriter is in “their discretion” territory, there really is a lot of room for The Underwriter to do pretty much whatever they deem necessary to be comfortable with approving the loan. If there is a declining income vs an increasing income…expect problems and delays and be prepared for a potentially very bumpy ride to the “approved and funded” day.

Column Three: Bonus income is calculated the same as hourly income…a two year average. So if your income is part salary and part bonus, the safest way to proceed is based on the salaried portion only, especially if the bonus income is a small amount. If you do want to include the bonus income, you need to know that not only will the lender require a consistent history of bonus income, BUT may require your employer to put in writing that they expect that level of bonus to continue for X period of time into the future.

In these economic times it is The Underwriter’s Discretion regarding how much to count OVERTIME and/or BONUS income. They may decide not to count it at all unless your employer is willing to guarantee that extra income for several years out from now.

Column Four: There is no Column Four BUT if there were a Column Four it would be for people whose ENTIRE income is commission based. Also in Column Four would be people whose entire income comes from a business venture.

Also, regardless of income source, if you are applying for a JUMBO loan…well, just about anything can happen. The number of hoops one may have to jump through to get a JUMBO loan are many and varied and change from lender to lender and from one minute to the next.

Likely the biggest snafu that can happen unexpectedly is when someone owns a rental property. Maybe one of the Lending Professionals can help with this in the comment section of the post. Suffice it to say that the Lender does not look at rental income the same way that someone who owns a rental does…not at all. They only count 75% of the rent as income, while counting all of the mortgage payment on the rental property as an expense. So if you think that $2,000 rent wipes away the $2,000 mortgage payment and is “a wash”…not so. So if you own a rental property, make sure you make that fact known BEFORE getting a preapproval letter and before making an offer on a house.

Last but not least is you cannot count the Rental Income of a property you are buying as a rental. Yes, we know you will be getting rent, but that rent is not counted AT ALL because you have no HISTORY of rental income from that property at time of purchase. Two or three years from now you can count that rental income when doing a refinance, but at time of purchase…you have to qualify to buy it without considering the income you will derive from it.

Some day when you are wondering why EVERY escrow that had a preapproval does not close…you may want to come back and read this again.

You Should Not Be Buying a House If You Don’t Get This

New WA State Short Sale Seller Advisory and Licensee Guidance Bulletins

The Real Estate Division of the Washington State Department of Licensing and the Department of Financial Institutions have issued two bulletins about short sales. The DOL  Short Sale Advisory is for home sellers but really should be for both sellers AND their Realtors/real estate brokers.  DFI’s companion advisory is titled “Short Sale Guidance for Licensees” and contains many Q&As for both loan modification and short sale negotiation services. 

The DOL Seller Advisory contains basic education about short sales, the deficiency, “walking away” by letting the home go into foreclosure, options for homeowners in financial distress, warnings about predatory loan mod firms and other scams, and where to go for free help. The DOL Advisory also offers a signature page for the seller. There’s not a place for the real estate listing broker to sign the DOL Advisory.  I’d also like to see the Advisory offered in different languages. From the Advisory:

“FIRST, Understand that a Short Sale May not Discharge the Debt. You should know whether you will still owe your lender money (a deficiency) after the short sale. You should know this BEFORE you close the sale of your home. Even if a lender agrees to a short sale, the lender and any junior lien holders, may not agree to forgive the debt entirely and may require you to pay the difference as a personal obligation. This outstanding personal obligation could result in a subsequent collection action against you. For example, a lender may accept the short sale purchase price to “release the lien

How To Begin the Home Buying Process

Unfortunately most agents are trained to have a buyer make a list of everything they want in a home as the first step in the home buying process. Left to their own devices without this “push” in the wrong direction, RARELY does a future home buyer start by making a long list like that. It is a “sales” tool to lock you into a close-able position. Don’t buy into that logic by handing a “salesperson” a big list of what you “want”.

Three of the most common “first steps” to buying a home in my 20 years in this business have been:

#1 – Highly Ranked Schools

There is always a lot of controversy surrounding the topic of “best schools” as determined by a ranking system or online school ranking site. Still, many parents use these sites when determining where they are going to be buying a home. My clients tend to use a combination of these two sites:

GreatSchools.org ranks the schools on a scale from 1 to 10. Yes, I have actually seen a school on The Eastside ranked as “1” on a scale of 1 to 10. Makes you want to go peek in the windows and see what the heck is going on in that school. There is also a “star” system, but that seems to be generated by parents whose children already go to school there, so take that with a grain of salt and read the full comments of the parents vs the “3 star” or “5 star” ranking.

There may not be much difference between a 10 ranked school and a 9 ranked school…but clearly there must be a difference between a 10 ranked school and a 4 ranked one. If you love a house in an area serviced by a school ranked from 1 to 4, at least go to that school to try to determine why it has such a low ranking. You WILL get more home for your money if the school is ranked lower but each buyer has to decide where their priorities lie. For many…it is best school their money can buy vs best home regardless of quality of school, and the price per square foot of the home will often reflect that difference.

Another site my clients use, and they usually use both sites for comparison purposes, is:

SchoolDigger.com I like the 1 to 10 ranking system of GreatSchools.org better than the 1 to 5 ranking system of SchoolDigger.com, but I LOVE the display on a map of the schools with “balloons” showing the school ranking. Gives you a better visual of where that you can then match up to a home search map tool. I wouldn’t use these sites to look for homes though. The best real estate search tool for many, many reasons is Redfin.com, but my guess is if you are reading a real estate blog like this one…you already know that.

Even if you do not have children in school, you need to be aware of the impact of school rankings on home values so that you are using the correct “comps” when determining a fair price for a home. You don’t want to use a 10 ranked school as a comp for an offer to be made on a home in a 2 ranked school! Unfortunately, even appraisers haven’t learned that one yet. Be ahead of the curve. Do not be fooled into thinking that “School District” is the ONLY criteria to be used. There are often major variances within a school district.

Some School Districts like Lake Washington School District have a great online map of each school’s boundaries. Boundaries do change from time to time, so be sure to check with the district once you have found a home. Give them the exact address and know that if you are on the border between two schools vs dead center in the middle of the defined area…well, change happens and likely more near the edge lines. This is most important for people planning to have children or who have very young children who are not yet in school.

#2 – “Close-in”…or not “close-in”.

Wanting to buy a house that is “close-in” is more often a “move up buyer” request than a 1st Time Homebuyer request. Sometimes it is the opposite. They bought “close-in” and now want to be far away from “it all”. Unfortunately some learn the hard way how important it is for them to be close to or far away from…something. Everyone’s something is different. First Time Homebuyers tend to look at the WHAT vs the WHERE, and often end up someplace they hate being, causing them to rethink that where and move “out” if not “up”. In fact going from a bad “where” to a good “where” often means moving UP in Price but DOWN in home quality, size and amenities. The wrong where often results in more home for the money, which is why First Time Homebuyers tend to choose them more than experienced homebuyers.

You will often see “Great ‘close-in’ location!” in a real estate ad. What “close-in” means is different in each area. On the Eastside it could mean close to Microsoft, close to Redmond Town Center, close to Downtown Kirkland. On the Seattle Side it usually means you can walk to a coffee shop (and other shops). For those who don’t expect to walk to work, “close-in” could mean a reasonable bus or drive commute time. NOT “close-in” is a little easier to describe than “close-in”. If you have to drive for a half hour to get some milk…you are NOT “close-in”.

There are many variances on this “close-in” theme, and they are as different as people can be different. It’s a personal decision that you REALLY need to spend a lot of time thinking about. Some people hate the noise level of being too “close in” to shops that can also have very noisy restaurants and bars with drunk patrons very late into the night. Some people like to walk to enjoyable amenities, but be as far away from work as reasonably possible. Some people like to be very close to work, but in a private and quiet location when they get home and NOT close in to noisy businesses.

If there is ONE HUGE MAJOR MISTAKE of homebuyers that stands far and above beyond the rest of the mistakes you can make, it is to look at “a house” and make an offer on it, without adequately discovering what is around it. The MINUTE you think you may want to make an offer on a house, spend as much time as possible around that house before negotiations are complete and the home inspection “out” phase is passed. Park your car in front of the house and take long walks in every direction. Say hello to the neighbors. Don’t be afraid to do that! You don’t need to 3rd degree them with a list of questions, nor should you do that. But you should knock on the door and meet the neighbors to see if there is anything alarming to you about them. Why don’t people do that? No one wants to be “close in” to a problem neighbor…no one.

It’s very simple to get “drive times” now without having to leave your computer. Just put in the address of the home and various destination points into a service like Bing Maps and it will give you the estimated drive time. Be sure to double check that during rush hours IF you plan to be driving to and from during rush hour.

#3 Style of Home

Once you determine your suitable where(s), it is time to study the potential whats of that where that are IN YOUR PRICE RANGE.

IMPORTANT NOTE: Many homebuyers are afraid of Future Home Values. Take note that IF you buy a split entry home for too close to the max price for that style of home, you will not likely be able to get paid back for those improvements when you sell.

Yesterday I posted some rather harsh realities for people who want to be “close to Microsoft Redmond Campus” as in within a 2.5 mile radius of 148th Ave NE and 36th. Of great significance is the age of home possibilities.
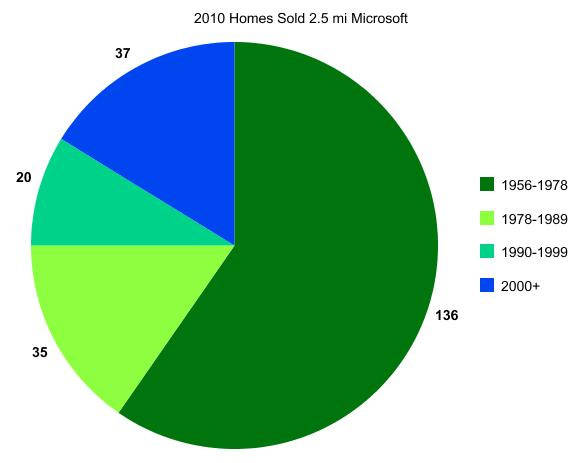
microsoft age

As you can see in the chart above, a large majority of the homes available and sold in that area were built more than 20 years ago. So wanting a house not more than 10 years old within a mile or two from work at an affordable price may look great on your “WANT” list…but easier said than done. That is why it is important to study the makeup of the area you choose, before going out to look at homes.

Besides the age of home, the style of home is also an important factor. You may “like” granite counters and stainless steel appliances…but that is NOT “real estate”. Way too many people choose a home by its “finishes”. A newer 2-story home that has laminate counters and ugly carpet MAY be better than a less favorable home style with hardwood floors and granite counters, depending on your needs and price range.

BIG NOTE: IF YOUR BEDROOMS (AT LEAST 3 OF THEM) ARE NOT A FULL FLIGHT OF STAIRS ABOVE YOUR KITCHEN AND LIVING AREAS…IT IS NOT, NOT, NOT A 2-STORY HOME! I have met many a seller in a Split Entry or 1 story with basement who said “we have always called it a 2-story home”. Reverse floor plans, and I have seen several on market recently, are a little harder to define. If the view from the main level on a reverse floor plan is knock your socks off awesome…well, let’s just say it better be.

Here are 3 examples of how to look at the general range of possibilities before going out to look at homes to buy.
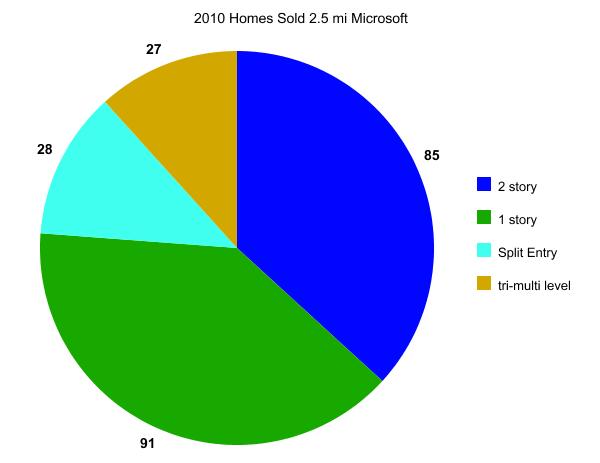
microsoft type

In the pie chart above you can see that the majority of homes in that area (within 2 miles of Microsoft) regardless of price, may be a home style that you simply do not care for. It is important to know that before going out to look for your “ideal home” in an area that may not have it in your price range. Do you go further out to find “it”…or do you stick to living near work? A personal decision you should make before going out to look at homes. Have a backup plan!

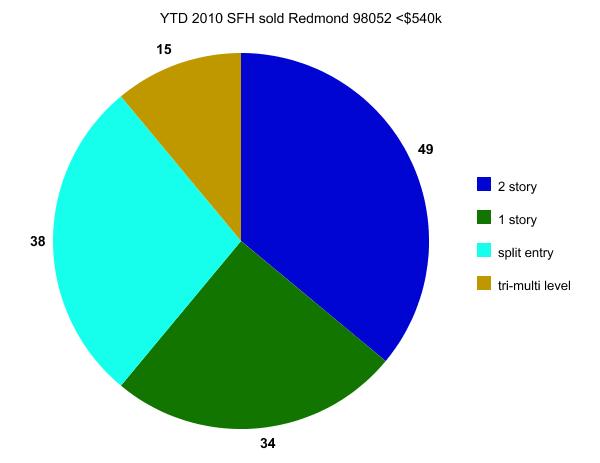
Besides availability, there is a matter of cost. Below I charted all of 98052 using the current YTD median home price of $540,000 as a guide. This first pie chart below breaks down the style of homes sold so far in 2010 costing $540,000 or less in Redmond 98052. Often 2 story also equals “newer home”. Not always…but often…on the Eastside vs in Seattle proper.
graph (8)

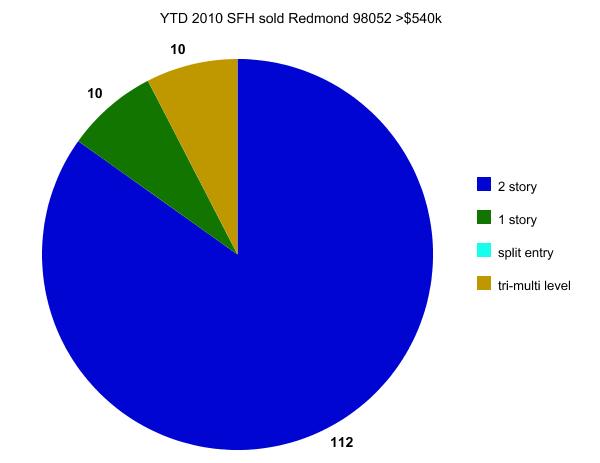
Once I go over the median home price, the breakdown of home style changes dramatically, as shown in the pie chart below. This is VERY important to home buyers in the first group. IF you bought the highest priced Split Entry home UNDER the median home price…note that NO Split Entry Homes were sold above that median price YTD 2010. Future home appreciation is not simply about “the market” as a whole. There is a point at which there simply is no room for upward movement given you simply cannot compete with newer homes and newer home styles regardless of how you may improve that home.
graph (9)

It is pretty simple to graph out your potential and likely choices in your price range in the area you hope to live. It’s OK to look for a needle in a haystack…you just have to know that before you begin the process. What has NEVER happened in the past, is not likely to happen in the near future. If 1% of the people were able to do what you are trying to do, that is important to know the same as it is important to know if 60% of the people were able to do that in recent history.

You clearly will be able to change what you “WANT” a lot easier than you can change the makeup of homes built in a given area. If it never was built, you likely can’t buy it. So do your homework before you step out the door and get caught up in making quick on the fly changes in your overall home buying plan. Be prepared and you will make a wiser choice.

********
(required disclosure: The stats in this post and its graphs are not compiled, verified or posted by The Northwest Multiple Listing Service.) They are hand calculated by ARDELL.

Truliaboy Refinances His Short Sale Purchase

Truliaboy PuppyBack in early October, I wrote a brief story of a young man (whom I have dubbed as “Truliaboy”) who purchased a nice home via a short sale at 15% under the then current market value. It is a beautiful home on over an acre of land purchased for less than $300,000. With his permission I am posting this follow up story for the benefit of those who purchased “awesome deals” with little down, to show how one person was able to get rid of the Mortgage Insurance Premium via a refinance, and save a lot of money on interest as well, less than one year after his original purchase.

At time of purchase, the Annual Percentage Rate (including up front loan costs) on Truliaboy’s TIL (Federal Truth-In-Lending Disclosure Statement) was 5.336%. The recent refinance that closed last week carries an APR of 4.491%…a considerable savings. On the original 30 year loan, the Total Finance Charges for the life of the loan show as $260,169.12. On the recent refinance the new charges for the life of the loan show as $221,385.09.

Total Savings = $38,784.03.

Back to the issue of the Mortgage Insurance Premium. The Mortgage Insurance Premium on the original loan was $109 a month, and the loan amortization on the TIL included this amount for the first 9 years plus 5 months on a slightly decreasing scale. $109 a month in the first year and down to $93 a month in the final payments. By eliminating the monthly mortgage insurance premium, Truliaboy saved approximately $11,300 in monthly mortgage insurance premium payments.

His original monthly payment, including MIP, was $1,536.60. His new payment is $1,363.05. Total savings in his current monthly payment $173.55 per month.

1) If you purchased a house in the last year or two at significant savings by buying a short sale or a bank owned home with less than 20% down, you should look into the possibility of getting rid of your Mortgage Insurance Premium by refinancing your loan IF the current value is likely 20% less than your new Total Mortgage Amount.

2) Be sure to re-evaluate the Total Savings vs. the Total Cost of the New Loan AFTER the new appraisal comes in. It could cost you a few hundred dollars in “wasted” appraisal fee, but you need to be ready to pull the plug IF the new appraisal does not come in at an amount that will equal a new Loan to Value that is more favorable than your original loan. Make sure the monthly savings via reduced or eliminated Mortgage Insurance Premium (and interest savings if applicable) justify the cost of the refinance. Check your “comps” in advance as much as possible, to help determine the odds of a successful outcome.

3) Be sure to make as many LOW COST improvements to the home (if you have not already done so) to help insure a successful new appraised value. Clean and stage your home for the appraiser’s visit the same as you would for a potential homebuyer.

Part of the success lies in the fact that Truliaboy made some improvements to the home in the short time that he has owned it. The cost of the home’s improvements since time of purchase was approximately $10,000 to $12,000 BUT Truliaboy used his $8,000 First Time Homebuyer Tax Credit to make a huge dent in the cost of those improvements.

That is an AWESOME example of how to spend your $8,000 Tax Credit wisely, and parlay it into additional savings over the time you will be living in the home, by using the improved value to get rid of the PMI / MIP!!!

As in the original story, Truliaboy gets all of the credit from me for a job well done…AGAIN! Though Truliaboy continues to credit St. Joseph for his HUGE success story, I think it was a combination of factors, not the least of which was Truliaboy’s efforts that caused St. Joseph to bless him with this successful outcome.

If you were wise and lucky enough to purchase a home at considerably less than the appraised value at time of purchase in the last couple of “sub-prime crisis” years, and you bought the home with less than 20% down payment, be sure to look into the possibility of turning that “instant equity” into REAL today savings by eliminating the Mortgage Insurance Premium via a refinance.

This Week in Seattle Real Estate

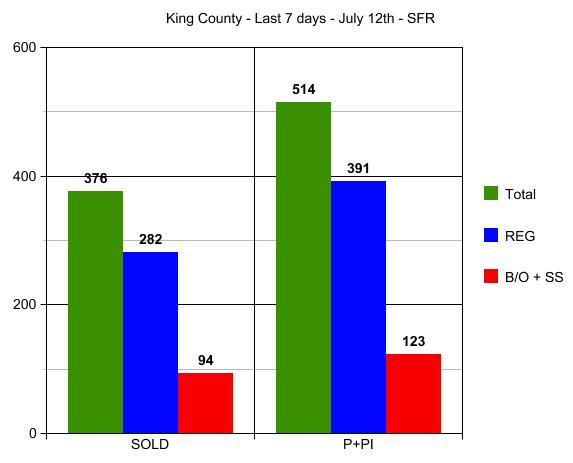
Short Sales and Bank-Owned property as a percentage of the total market is a very important topic. One worthy of tracking on a week to week basis. There seems to be a false sense that these are “evenly distributed” throughout the County. Rather than get into a “yes they are; no they’re not” spitting match, let’s look at the actual data.

King County as a whole:
7-12 kc

In the graph above we see that 25% of all property sold in King County this week were “distressed” sales. For those who like the break down, 49 of those 94 were Bank-Owned properties and 45 were Short Sales. Not a significant imbalance one to the other. Not a significant difference in % of total sales on those that went Pending this week. I’m counting Pending Inspection and Pending since that will not duplicate the stats and will capture those that went straight to Pending with no inspection requested. That total is almost 24%…so not a big difference between closed sale data and pending sale data.

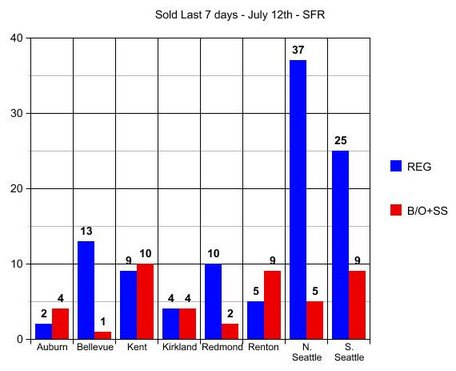
BUT when you look at some of the break-downs by area…HUGE DIFFERENCES!

7-12 sold

4 out of 6 of the closings in Auburn were distressed property, but only 1 of the 14 in Bellevue was distressed. 9 of the 14 sold in Renton were distressed property, but only 2 of the 12 in Redmond were distressed. Kirkland’s results are over-stated here and usually look more like Bellevue and Redmond’s numbers. You can see that in The Pending Sale Chart which for some reason would not post here, so I put it over on my blog.

I will try to run the stats every Monday so that we can combine them in 4 week comparison blocks. The results will vary somewhat from week to week, BUT some areas are clearly 50% or more distressed property, while others are only 10% to 15% distressed property. Looking at valuation factors for all of King County as a whole will not tell you enough. You could clearly be overpaying for a home in some areas, if you are using a County Wide % as to how much the market is up or down. There is a HUGE variance, as you can see in the graph here and the one over on my blog.

Again, apologies for not putting that 3rd and final graph down here and diverting you elsewhere to see it. When Dustin gets back from having fun, maybe he can figure out why it wouldn’t take.

(required disclosure – the stats in this post and graph were not compiled verified or posted by The Northwest Multiple Listing Service)

Oil Spill Wildlife Rescue Event – Columbia Tower

oil spillThursday
*
July 15th
*
there will be a charity event at The Columbia Tower Club at 6:30 p.m. to benefit The Nature Conservancy and help with their Wildlife Relief efforts.

Tickets are $35. Ticket purchase and full event info can be found at the Oil Spill Wildlife Rescue Event site.

For the ticket price of $35 participants will get:

1) Flavor of Seattle local dining cards – normally retailing at $35 (up to $500 in savings).
2) Complementary hors d’oeuvres
3) 10 raffle tickets good for the chance to win some fantastic donated prizes

The 10 raffle tickets alone offer an amazing array of potential side benefits of assisting in this cause:

AUCTION and RAFFLE Items are coming from the below local establishments (list not all inclusive) and the $35 entrance fee gives you 10 raffle tickets toward the drawing.

The Four Seasons
The Hyatt
John Howie Steak
Sea Star Restaurant
Dulces Latin Bistro
Le Gourmand Restaurant
Ray’s Boathouse
Cafe Campagne
Toulouse Petit
Swinery Meats
DeLille Cellars
O-Wines
Secret Stash Seasalts
Chef Amadeus
Liberty Bars
Fresh Seafood
Herban Creations

A great night out in the clouds at The Columbia Tower Club (business casual dress required), a great cause AND a great deal! Hope to see you all there…6:30 p.m. Thursday, July 15th.

Oil Spill Wildlife Rescue Event - Columbia Tower Club

Oil Spill Wildlife Rescue Event - Columbia Tower Club

Can Seattle Home Prices Drop “Another” 22%?

Can Seattle Home Prices Drop Another 22% was a question raised by many here in the Seattle Area, after Zero Hedge posted the Goldman Sachs forecast for Major Cities showing Seattle at a 22% drop by year end 2012. After calling for modest to almost no declines in several major cities, Goldman predicted a 22% drop for Seattle with the 2nd highest drop being only 12% in Portland, and even a 7% gain for Cleveland Ohio and a 5% gain for San Diego. That would put Seattle at minus 27% compared to San Diego for the same period.

You can pick up Goldman’s rationale or lack thereof in that first link, we’ll stick to how likely it is that Seattle could drop “another” 22%. First let’s take a look at where a drop of that size would takes us, in the graph below.
graph (1)
Important to note that I made a slight modification of the raw data for the graph above to account for modest home size variances, equalizing the data as to size of home or price per square foot. The closest rounding point was a median sized home of 2,000 sf. The data is in thousands, so top left in January of 2007 would be $430,000 median home price for a 2,000 sf home and bottom left would be $253,000 for a 2,000 sf home in January of 2001.

I posted a full chart of all of the raw data for those who want to create their own charts and modifications showing actual median home prices for the years in the graph above, median square footage of homes sold in each 30 day period and the # of homes sold. This is for Single Family Homes vs. Condos and King County vs. Seattle Proper.

Back to the graph above in this post. The top line is Seattle Area Peak in 2007. The turquoise and purple lines are “where we are” in 2009 and 2010 without significant difference except for seasonal variances in that 18 month period. I ended these graphs and the data at April 30 2010 due to the switch out of mls systems locally, but am seeing reports that May came in above April at $379,000. So the raw data suggests there is the normal seasonal bump up in May, as additionally influenced by the final tax credit closings which will continue until after June closings, and possibly slightly beyond.

The red line is the hypothetical Goldman Sachs prediction scaled against 2009 data at 22% below in each consecutive month.

********

Before moving to conclusions, we need to visit the volume stats (graph below). I have been tracking volume for years in addition to price per square foot, as volume signals recovery or not more so than home prices alone.

graph (2)

Analysis is dependent on rationale of which data to apply, and for my purposes I have been using 2001 and 2002 as “Base Points” for two reasons:

1) 2001 is the earliest I will go when tracking home price and volume data, as Credit Scoring as the primary focus of lending pre-approval guidelines and risk-based pricing, was not a factor in the 90’s. Keeping apples to apples as to the number of people who can qualify to purchase a home, 2001 is a good start point.

2) 2003…toward the end of 2003…was the beginning of ZERO down/sub-prime lending standards. So all years from 2003 through mid 2007 will include an extra bump up as to volume and price created by that loosest of lending standards.

For both of the reasons noted above, it has been my long standing premise that volume of homes sold should be and can be expected to return to 2001 and 2002 levels as to number of homes sold.

One caveat: The number of condos built between 2001 and present is beyond proportional. Those additional “residences” in the form of condos and lofts in the Seattle Area will rob volume from the single family stats in some, and many, areas.

Note: In the second graph above, the volume of homes sold in October of 2009 (green line) exceeded the number of homes sold in October of 2001 (black line). This may not seem like something to view as a positive sign. But given the tremendous drop in volume as noted in January and February of 2009 to unprecedentedly low levels, surpassing 2001 volume stats by October of that same year was HUGE. Of course these numbers at both ends are influenced by the short breaks in the tax credit for home buyers in both January of 2009 and October of 2009…but still a significant signal reflecting that volume has the opportunity to recover to 2001 levels. NOT to 2007 levels! Volume cannot and will not recover to 2007, nor do I expect prices to do so until 2018 at the earliest.

Those who are waiting for a return to 2007 as to price and/or volume would likely have better luck betting on your favorite horse.

********
So, just how low will Seattle Area Home Prices go? Well first off let’s acknowledge that Seattle Area Home Prices WILL go DOWN. That seems obvious to me from the RAW DATA, but amazingly I still see many people questioning whether or not the market will go down at all from here. Hard to believe, but yes, some think the current level of $379,000 median home price is going to go up and not “EVER” down from there. One would think the credo of “home prices will never go down” was dismissed along with The Easter Bunny…but no. Some are still looking for a V-Shaped or U-Shaped “Recovery”. Sad but true.

A- Home prices will most assuredly drop by 4.3% in the very near future and likely by 4th Quarter 2010. (See blue square in the RAW DATA link above.) That is where home prices were in March of 2009 before the tax credit was renewed. So seems obvious without the credit, that is where prices will go back to…and likely lower than that without a new tax credit to prop up prices from that point forward.

B- The Tax Credit was meant to stop the downward spiral and eradicate the portion of loss created by momentum and NOT the portion of downward spiral created by fundamental economic problems. It was to eliminate the Fear Factor and the over-correction. Not the market’s legitimate decline point. Consequently the “safety net” being removed is going to create an additional drop of at least 5% in addition to the 4.3% drop noted above, which would take us to a drop of 9.3%.

C- Goldman Sachs is incorrect in its analysis of a 22% drop, because they do not apply the above A and B factors to all Major Cities. So their basic rationale is not credible, nor the number that emanated from that incorrect rationale.

D- Near the end of the time frame for the tax credit, home buyers were not as likely to enter into contracts with short sales and to some extent even bank-owned properties, for fear they would not close on time. Consequently, the median home prices were overly weighted to the high end of my bottom call. The mix of property from here through year end is going to push more toward the 37% under peak of that same bottom call vs the 20% side of the equation, with more “distressed” property in the mix. Not because of increased foreclosures, but because of more people being willing to buy them without a drop-dead-must-close date via the tax credit. It’s really just common sense, and pretty much a given.

Look for a 9.3% drop at some given point between now and the end of 2011. That would be any month in that period with a median home price of $343,753 or thereabouts.

As to 2012??? I expect a significant impact on price, with further declines, stemming from continued layoffs between now and the end of 2012 on a fairly large scale. But this last prediction borders on “the crystal ball method”. So let’s end with a 9.3% drop from $379,000 median King County home price by year end 2011, with an added caution that significant improvement to 2007 price levels will not likely happen before 2018.

In other words…”EXPECT the worst; HOPE for better than that.”

(required disclosure – Market Observations and all stats in this post and the graphs herein are the opinion and “work” of ARDELL DellaLoggia and not Compiled, Verified or Posted by The Northwest Multiple Listing Service.