WA State Real Estate Agents are now Brokers.

On July 1, 2010, real estate salespeople in Washington State will become brokers.  It’s taken the Department of Licensing a total of seven years from initial research to the final implementation having started in 2003 on this project. The revisions passed the legislature in 2008 and the law is now in effect. There are many, many questions still to be answered during the rule-making process which makes the transition challenging but not impossible.  Here are some of the higlights:

  • There are now two levels of licensure for individuals: broker and managing broker.
  • The ‘salesperson’ category has been eliminated. The entry-level license for an individual is now “broker.”
  • A person with three years of experience as a broker will now be able to become a managing broker.
  • The 2010 license law requires the licensing of brokerage firms. A real estate firm is any business entity (including a corporation, partnership, or sole proprietorship) that conducts real estate activities.
  • All real estate services contracts are between the client and brokerage firm, instead of between the client and any individual licensee. A listing agreement is the property of the brokerage firm.
  • A designated broker is responsible for meeting all recordkeeping and trust fund requirements, plus he/she has supervisory responsibility over all the firm’s licensees.
  • All first-time broker license applicants must submit fingerprint identification.
  • Those renewing their licenses must also submit fingerprints and have their backgrounds checked every six years.
  • Educational requirements have been increased for first time broker licensees as well as managing brokers. Existing licensees must take a transition course to update them on the licensing law changes.
  • A broker with less than two years’ experience (remember, I’m talking about a new real estate agent, now referred to as a “broker) is subject to one additional responsibility: working under a heightened degree of supervision. He or she must conduct all brokerage activities under the direct supervision of a designated or managing broker, and submit all signed documents to the designated broker for her review, within five days of the signing, and submit evidence of their required education courses to the designated or managing broker.

There are more changes relating to recordkeeping, trust accounts, the role of firms, and property management. The complete law and its rules can be found here.

I highly recommend all real estate agents brokers and other interested stakeholders join the DOL’s listserve. DOL sends out a new set of Frequently Asked Questions each week and has been doing a great job of keeping us up to date during the transition.

The following links are from the Department of Licensing
Overview
Frequently Asked Questions

Rulemaking

During the Transition Course, I’ve been asking my students at the end of class if they believe the new law changes will help the industry, hurt, or make no difference.  The majority of students believe the changes will help the industry raise the bar.  The three biggest changes they are happy with are: 1) the increased level of supervision required of new licensees;  2) the mandatory fingerprint/background check; and, 3) the increased level of required prelicensing education for new agents brokers.

As a side-note, I’ve had more than a handful of students ask what kinds of conviction on the background check would dis-qualify them from keeping their real estate license.  For the answer to that question, follow this link and scroll down to the section on “fingerprinting.”

Can Seattle Home Prices Drop “Another” 22%?

Can Seattle Home Prices Drop Another 22% was a question raised by many here in the Seattle Area, after Zero Hedge posted the Goldman Sachs forecast for Major Cities showing Seattle at a 22% drop by year end 2012. After calling for modest to almost no declines in several major cities, Goldman predicted a 22% drop for Seattle with the 2nd highest drop being only 12% in Portland, and even a 7% gain for Cleveland Ohio and a 5% gain for San Diego. That would put Seattle at minus 27% compared to San Diego for the same period.

You can pick up Goldman’s rationale or lack thereof in that first link, we’ll stick to how likely it is that Seattle could drop “another” 22%. First let’s take a look at where a drop of that size would takes us, in the graph below.
graph (1)
Important to note that I made a slight modification of the raw data for the graph above to account for modest home size variances, equalizing the data as to size of home or price per square foot. The closest rounding point was a median sized home of 2,000 sf. The data is in thousands, so top left in January of 2007 would be $430,000 median home price for a 2,000 sf home and bottom left would be $253,000 for a 2,000 sf home in January of 2001.

I posted a full chart of all of the raw data for those who want to create their own charts and modifications showing actual median home prices for the years in the graph above, median square footage of homes sold in each 30 day period and the # of homes sold. This is for Single Family Homes vs. Condos and King County vs. Seattle Proper.

Back to the graph above in this post. The top line is Seattle Area Peak in 2007. The turquoise and purple lines are “where we are” in 2009 and 2010 without significant difference except for seasonal variances in that 18 month period. I ended these graphs and the data at April 30 2010 due to the switch out of mls systems locally, but am seeing reports that May came in above April at $379,000. So the raw data suggests there is the normal seasonal bump up in May, as additionally influenced by the final tax credit closings which will continue until after June closings, and possibly slightly beyond.

The red line is the hypothetical Goldman Sachs prediction scaled against 2009 data at 22% below in each consecutive month.

********

Before moving to conclusions, we need to visit the volume stats (graph below). I have been tracking volume for years in addition to price per square foot, as volume signals recovery or not more so than home prices alone.

graph (2)

Analysis is dependent on rationale of which data to apply, and for my purposes I have been using 2001 and 2002 as “Base Points” for two reasons:

1) 2001 is the earliest I will go when tracking home price and volume data, as Credit Scoring as the primary focus of lending pre-approval guidelines and risk-based pricing, was not a factor in the 90’s. Keeping apples to apples as to the number of people who can qualify to purchase a home, 2001 is a good start point.

2) 2003…toward the end of 2003…was the beginning of ZERO down/sub-prime lending standards. So all years from 2003 through mid 2007 will include an extra bump up as to volume and price created by that loosest of lending standards.

For both of the reasons noted above, it has been my long standing premise that volume of homes sold should be and can be expected to return to 2001 and 2002 levels as to number of homes sold.

One caveat: The number of condos built between 2001 and present is beyond proportional. Those additional “residences” in the form of condos and lofts in the Seattle Area will rob volume from the single family stats in some, and many, areas.

Note: In the second graph above, the volume of homes sold in October of 2009 (green line) exceeded the number of homes sold in October of 2001 (black line). This may not seem like something to view as a positive sign. But given the tremendous drop in volume as noted in January and February of 2009 to unprecedentedly low levels, surpassing 2001 volume stats by October of that same year was HUGE. Of course these numbers at both ends are influenced by the short breaks in the tax credit for home buyers in both January of 2009 and October of 2009…but still a significant signal reflecting that volume has the opportunity to recover to 2001 levels. NOT to 2007 levels! Volume cannot and will not recover to 2007, nor do I expect prices to do so until 2018 at the earliest.

Those who are waiting for a return to 2007 as to price and/or volume would likely have better luck betting on your favorite horse.

********
So, just how low will Seattle Area Home Prices go? Well first off let’s acknowledge that Seattle Area Home Prices WILL go DOWN. That seems obvious to me from the RAW DATA, but amazingly I still see many people questioning whether or not the market will go down at all from here. Hard to believe, but yes, some think the current level of $379,000 median home price is going to go up and not “EVER” down from there. One would think the credo of “home prices will never go down” was dismissed along with The Easter Bunny…but no. Some are still looking for a V-Shaped or U-Shaped “Recovery”. Sad but true.

A- Home prices will most assuredly drop by 4.3% in the very near future and likely by 4th Quarter 2010. (See blue square in the RAW DATA link above.) That is where home prices were in March of 2009 before the tax credit was renewed. So seems obvious without the credit, that is where prices will go back to…and likely lower than that without a new tax credit to prop up prices from that point forward.

B- The Tax Credit was meant to stop the downward spiral and eradicate the portion of loss created by momentum and NOT the portion of downward spiral created by fundamental economic problems. It was to eliminate the Fear Factor and the over-correction. Not the market’s legitimate decline point. Consequently the “safety net” being removed is going to create an additional drop of at least 5% in addition to the 4.3% drop noted above, which would take us to a drop of 9.3%.

C- Goldman Sachs is incorrect in its analysis of a 22% drop, because they do not apply the above A and B factors to all Major Cities. So their basic rationale is not credible, nor the number that emanated from that incorrect rationale.

D- Near the end of the time frame for the tax credit, home buyers were not as likely to enter into contracts with short sales and to some extent even bank-owned properties, for fear they would not close on time. Consequently, the median home prices were overly weighted to the high end of my bottom call. The mix of property from here through year end is going to push more toward the 37% under peak of that same bottom call vs the 20% side of the equation, with more “distressed” property in the mix. Not because of increased foreclosures, but because of more people being willing to buy them without a drop-dead-must-close date via the tax credit. It’s really just common sense, and pretty much a given.

Look for a 9.3% drop at some given point between now and the end of 2011. That would be any month in that period with a median home price of $343,753 or thereabouts.

As to 2012??? I expect a significant impact on price, with further declines, stemming from continued layoffs between now and the end of 2012 on a fairly large scale. But this last prediction borders on “the crystal ball method”. So let’s end with a 9.3% drop from $379,000 median King County home price by year end 2011, with an added caution that significant improvement to 2007 price levels will not likely happen before 2018.

In other words…”EXPECT the worst; HOPE for better than that.”

(required disclosure – Market Observations and all stats in this post and the graphs herein are the opinion and “work” of ARDELL DellaLoggia and not Compiled, Verified or Posted by The Northwest Multiple Listing Service.

Buying a Bank-Owned Home? Ball’s in YOUR Court!

Interestingly, the very same day that Craig wrote his post on assisting a buyer with a bank-owned purchase, I was closing on a very similar transaction.

One difference…mine closed. 🙂

It was even the same servicing company (so possibly and even probably the same bank-owner-seller), and also an FHA loan like Craig’s transaction. Two hurdles that Craig’s transaction may or may not have had was there were multiple offers (hard to win multiple offers if you are the only FHA buyer in the room) and the buyer’s lender at the last minute required that a new roof be put on the house, prior to closing, on a house that was only 14 years old.

I have to agree with Craig, it was absolutely grueling. It’s like being Ray Allen playing against the Lakers, but there is no one else on the Court except Ray!There were too many cooks in the kitchen on the seller side, and it was almost as if they wanted you to be late and wanted the transaction to fail. At the point where the buyer’s lender wanted a new roof on the house prior to closing, I honestly think the seller wanted to move to the back up buyer AND keep my client’s Earnest Money AND collect a $100 per day per diem for as many days as possible running through the Memorial Day weekend and beyond. This is why the SELLER should NEVER be ALLOWED to choose escrow! Somebody wise up and make a law about that!

Think about it. If escrow doesn’t close on time on a bank-owned…who suffers? Buyer can lose their Earnest Money. Buyer can pay $100 per day for every day that it is late (to the seller). So how can the seller be the one who chooses escrow, when the buyer is the one with so much at stake, and the seller with everything to gain if the buyer is late?

Of course my buyer clients did close. My buyer did not close on time BUT he also paid ZERO in per diem costs because I forced the seller’s hand to the point that they were in breach. This is not the first time I have done this with a bank owned, but it takes every ounce of my time and energy for days on end. You have to have your wits about you, stay on your toes, and play every single second, day after day, with the devotion of a Ray Allen or Rondo watching every single move and being always on top of your game. One false move…one split second of incorrect decision, is the difference between the client’s success and failure.

In this corner…the seller side…we have:

Agent for seller…Assistant for agent for seller…off-site transaction coordinator for agent for seller – Escrow Company chosen by seller with TWO closing agents, one working only on the seller side and one working only for the buyer side. FIVE layers before you even get near who the seller is, and the seller has at least a few people in between all those people and the actual selling entity/bank.

…and in this corner we have…ARDELL LOL! Kim and Amy helped do a few end runs on what the buyer was doing AT the house, like choosing new hardwood and getting estimates from painters, etc. I handled the contractual and escrow problems and the buyer’s lender issues…including lender wanting a roof ON the house prior to closing. Trust me, it is no easy feat to put a quality roof on quickly on someone else’s house without their permission. …and of course…then the rain came… If we were not ready to close the buyer would have lost his $10,000 Earnest Money and/or all those many days over the very long holiday weekend in per diem fees.

Like Craig, I can’t give a true blow by blow…but it closed and my buyer clients got the house at roughly $50,000 less than the house around the corner in the same neighborhood, that closed at roughly the same time. It was imperative that THIS be the house, as they maxed out at a price just short of what it would cost for all the things they wanted in a home, school and neighborhood. So a bank-owned was likely the ONLY way for them to get all of those things because of the bank-owned discount.

So yes…for many clients, buying a bank-owned is not only best…but sometimes the ONLY way for them to achieve their goal. The number one thing to remember to be successful in a bank owned transaction is The Ball Is ALWAYS In YOUR Court! You cannot wait ONE SECOND for the other side to do what they are supposed to do. You must do their work…yes they were the ones who needed an extension, but if I did not keep writing the addendums, because it was “their job” and not mine, it never would have closed! I had to do that three times. Banks NEVER answer…they never signed the extensions until it closed…pretty much at the same time.

You cannot ask…you cannot wait for them to answer…you cannot expect them to do what they are supposed to do. You have to run that ball across the Court like you are the only one in the room with the power to make it happen! You can’t worry about what’s fair and not fair…you just have to get it done and do everyone’s work , and figure out who has the authority to move it forward and who does not.

In my case the buyer also had all kinds of things besides dealing with the seller side that made it many times harder, even if it were not a bank-owned transaction. That was a bit distracting. But at the end of the day…it was all worth it, because I truly believe I could not easily find a replacement property for those clients in their price range. THAT is why you do a bank owned…because the discounted price makes it the BEST house for that client…and possibly the only one they can afford that fits their parameters. …and, of course, they also got the $8,000 tax credit on top of that. A grueling work load and struggle…but well worth it.

You don’t do it ONLY for the “bargain” of it…you do it because it is the very BEST house for them.

Similar story: Truliaboy gets his house and a puppy.

Don’t blame the Agent…if you are impatient.

There are a million articles written on the Top 10 Mistakes that Home Buyers make. Today…the biggest mistake one can make is to set a rigid time frame as to WHEN you WANT to buy. Let me re-phrase that in light of the email I just received below from someone who is not my client.

“Ardell, I am seeing many sellers hanging on to those 2007 prices. I mean wouldn’t being 12% below a 2007 purchase price be considered a little high? Properties are closer than ever now to late 2004 pricing aren’t they? Many houses we look at have asking prices higher than what sellers purchased them for in 2005 or later. I’m really getting tired of this.”

First let’s review the data again.
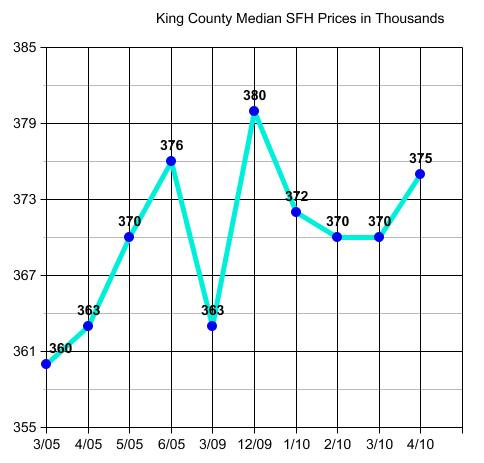
graph (43)

King County median home price is/was at $375,000 a week or so ago, up from $362,700 as of the end of March 2009, and WELL above “late 2004 pricing” of $337,500.

I’m not saying prices won’t get to late 2004 levels. In fact I think they will get there or pretty darned close in some, though not all, areas. But to go out EVERY weekend…looking at homes and hoping they would now be at 2004 pricing when they are not, will result in your “getting tired of this”. It would be like my getting tired of my diet for not having lost 20 lbs this week. I know that’s going to take some time, and getting “tired of this” is NOT an option if I am to achieve my goal by my daughter Tina’s wedding date in October 🙂

Now let’s see how the numbers fall in different areas vs. “King County” median prices:

98052
Late 2004 median home price = $409,995 – April 2010 = $610,000

98006
Late 2004 median home price = $507,000 – April 2010 = $591,500

98033
Late 2004 median home price = $469,000 – April 2010 = $479,000

98103
Late 2004 median home price = $400,500 – April 2010 = $435,000

98038
Late 2004 median home price = $281,950 – April 2010 = $299,950

98023
Late 2004 median home price = $244,975 – April 2010 = $249,225

98109
Late 2004 median home price = $598,500 – April 2010 = $460,500

98125
Late 2004 median home price = $319,750 – April 2010 = $360,000

Some surprising results there, and in many cases those numbers come up VERY differently than what I have been seeing touted in recent news articles as to which neighborhoods are “stronger” than others these days.

There are different reasons for these results in the different zip codes. For example, if you are hoping for 2004 pricing, but are buying a house that did not EXIST in 2004…well, in some areas new construction is not likely to fall into the level of a home built prior to 2004.

One thing “the comps” don’t tell you, is how FAR the MAJORITY of home buyers has shifted from 2004 to present. How many are buying more reasonably priced homes where they can afford to put 20% down and get a 30 year fixed mortgage based on conservation ratios, as example.

It’s not ALL about “the market”…nor is it ALL about “this house”. First step is to know exactly where the area you are looking in falls…and if NO SELLER “wants” to price there…you may just have to stop looking for awhile. Looking for “best price” in May of any year, is not particularly realistic. It is what I call “The Season of Hope” and “Hope Springs Eternal”. Best prices often don’t happen until around October 15th in any given year.

Start with a realistic objective and DO NOT WEAR YOURSELF OUT looking and looking. Take your time. Pace yourself. If lowest possible price is your objective…”Spring Bump” period may not be the time you want to choose for being in your new home. Buying in August – September – October may be a better bet if you want “better pricing”, especially if no new housing stimulus packages are forthcoming.

Remember…”Patience is a Virtue” and one often has to fight their initial gut instincts, in order to become “virtuous”.

(required disclosure – Stats in this Post are not compiled, posted or verified by The Northwest Multiple Listing Service) They are hand calculated by me, and April medians may include the first few days of May before we switched to a new mls system. I used 4/1/10 as the start point…but no end date, since the system stopped updating data around May 4th and converted to the new system that does not provide similar statistic gathering capabilities.

The End of The World…as I know it.

It’s “$8,000 Friday”!

The Tax Credit expires today. For some people that means it is $8,000 Friday…for others it is $6,500 Friday, but any way you slice it is a very important day for many people who are currently buying homes.

Oddly, given I have not and never would have, advised my clients to buy to get a tax credit, two of my clients are in “issues” involving the tax credit expiring today, somewhat coincidentally.

There are many buyers who just happened to find the right home that just came on market last week or this week, who are biting their nails waiting for a seller response “by 4/30”. If the seller is a bank or someone out of State or out of Country, this is a serious concern today.

There are other buyers who have a signed around contract before 4/30/2010, but who are in the process of negotiating the home inspection. Cancelling on inspection for a $3,000 item, and losing an $8,000 credit as a result, is part of the decision process on inspection negotiations today for many people. If they choose a different house next week vs. the one they currently have in contract, they lose the opportunity of the tax credit.

Any way you slice it…the clock is ticking…and weighing heavily on many, many people today. For those in a “gray area” as to being eligible for the credit, and there are many and varied gray areas, it is even more difficult.

In my opinion, it IS part a an agent’s job to help you preserve the right to that tax credit, and work hard to that end today. It is also part of their job to lay out the consequence of cancelling on inspection in the next several days and buying a different house instead. But NO agent can guarantee one way or the other that you WILL in fact get the credit. We can only help preserve your right to request it.

For those looking to receive a $6,500 credit, be aware of this:

“Additionally, you must have lived in the same principal residence for any five-consecutive-year period during the eight-year period that ended on the date the replacement home is purchased. For example, if you bought a home on Nov. 30, 2009, the eight-year period would run from Dec. 1, 2001, through Nov. 30, 2009. (11/17/09)”

If you live here in a rental, and still own your previous residence in another State that you lived in for less than five years…as I said…lots of gray areas. At the end of the day…this particular “$8,000 Friday”…some will be better off and some will not. An important day in the lives of many people who are in the process of buying homes.

Is that home over-priced?

When my clients send me a home they want to see and ask for my thoughts, I often respond “nice house; seems a little over-priced to me”. Sometimes they wonder how I know that before seeing the house.

Using general statistics to establish an immediate reaction to price, gives you a good starting point for home valuation.
graph (41)

The above graph is a good “cheat-sheet” for shoot from the hip value reaction. We can see that the recent history bottom of 3/09 is equivalent to 4/05 pricing.

One of my clients sent me a property, nice one, and I quickly checked to see that the owner bought it brand new in the summer of 2004 for $600,000 and the asking price is $750,000. “Looks a bit over-priced” because it was brand new when they bought it, so they didn’t (or shouldn’t have needed to) remodel anything. We are at May/June 2005 pricing (as you can see in the above chart).

The market didn’t increase by 20% from Summer of 2004 to Spring of 2005. New homes depreciate as 2004 new carpet is now 2010 old carpet. 2004 new paint and hot water tank are now heading toward the down-slope of their life expectancy period.

By all accounts asking 20% more for a home bought new in 2004 is not likely realistic. Median home price in June of 2004 was $340,000. Current month to date median price is $375,000. so that would put that property bought for $600,000 in June of 2004 at $660,000 to $665,000 today before applying depreciation. ($375 divided by $340 times $600 = $660) So my gut reaction to a $750,000 asking price is that it is almost $100,000 over where it should be.

That doesn’t mean that someone won’t pay $750,000 for it. The only question is…Is that someone who will pay about $90,000 too much for it…YOU?

(Required Disclosure: Stats in this post are not compiled, posted or verified by The Northwest Mulitple Listing Service.)

Great Cause, Seattle Seahawks Ticket Drawing, Us in our Pajamas!!!

Hopefully you’re following along with our 365 Things to do in Seattle WA…but in case you haven’t heard about it yet we wanted to pass along our day 41 to you.  We are involved in a wonderful event raising money for local foster kids and the event is scheduled for this Sunday at Kirkland’s Tech City Bowl.  Our team is:  Striking Realtors and we’ll be dressed in our pajamas.  We would love it if you could make a donation to help these local foster kids and when you do you’ll be entered to win a pair of Seattle Seahawks Tickets 3 rows from the field.  Find out more about the drawing and the event on our 365inSeattle event and see how you can help.

We’ve Come a Long Way Baby

VirginiaSlimsThe other day, I received an email from someone who wanted to verify some surprising things he had heard about the “old days” of mortgage underwriting.   Before I go on any further about the details of the discussion, I feel the need to to give a “Surgeon Generals” type warning:  in no way do I nor Mortgage Master condone the outdated underwriting guidelines used in the “old days”.   It is interesting to see how much lending practices have changed over the years…for the better.

From Curious George:

“Heard some interesting historical information from a long time veteran of the real estate industry today.  I seems that at one time, for a woman’s income to be considered when she and her husband were purchasing a home, she needed a note from her doctor stating that she either had a hysterectomy or was going through menopause.  Apparently the fear was that if she became pregnant and couldn’t work for some time, they would not be able to pay their mortgage.  Then with the development and legalization of the birth control pill, the banks reconsidered and allowed 50% of her income to be used.   Eventually banks agreed to 100% of a womans income to be used.

Seriously though, I thought this was interesting.   Maybe you can confirm this.   It would be interesting to see how all of that affected home prices.  I’ll bet with people being to qualify for larger loans, prices got driven up.”

I’ve been trying to find information about this on-line and although I can find plenty about racial discrimination, I’m having a challenging time digging up on how women’s incomes were considered “back in the day”.   HUD and FHA’s websites glorify how their part in rescuring the American Dream during the Great Depression…I’m hard pressed to find early underwriting guidelines.

I decided to use my walking encyclopedia of all things mortgage to check the facts of this “almost unbelievable” depiction of lending history:  my 85 year old father-in-law who spent sixty years in local real estate, Bob Porter.   The first six years (fresh out of the Navy in 1945) selling real estate in North Seattle for Mutual Realty, Broadmor Realty and McPhersons while attending Seattle College (now named Seattle University).  The next twenty-two years were spent as a broker/owner of Southend Brokers with several branches in King County.  His resume continued as President of Pacific West Mortgage headquartered out of Burien and most recently as Chairman of Mortgage Master in Kent until his retirement in 2005.  Now that you know some of Bob’s background, here’s his response to “Curious George”:

“That’s right.  The industry led by FHA and VA would consider a wife’s income for short term debt such as car payments.  Professional women, teachers, lawyers, doctors and business owners income could qualify for mortgage payments on a case by case basis without a letter from their doctor.  Taking loan applications took a lot of diplomacy.  We would be sued for discrimination if we asked a woman for a doctors letter today.”

It’s hard to believe that underwriting guidelines were impacted by various forms of birth control and the progression of women’s rights.

When will housing prices recover? A national look.

Crystal Ball with HouseThis post is partly a follow on to Ardell’s earlier New Bottom Call post and comments on where our greater Seattle / Bellevue area home prices might go over the next few years.

 
When people ask me “How soon are home prices around here going to recover?”, I have been saying that I don’t think they will ‘recover’ for at least 3 to 4 years.

The question usually comes from someone who wants to sell, but is having a hard time dealing with the fact that the value of their home is down about 20% from the peak in summer 2007 – especially if that is when they bought it. Of course if they had bought it in early 2002, the value would have run up about 85% before it peaked, but it is truly much harder to take a loss than it is to take a gain 🙂

The next most common person asking the question is a buyer who is trying to decide if he or she is going to make money or lose money on their investment in a home. Recent history would certainly give one cause to pause on that question.

Of course there have been all kinds of predictions about which way the housing market is headed, and many of those predictions are colored by what is going on in the writer’s home market. But recently a friend sent me a very interesting analytical presentation of what is going on in the market, which included a map graphic showing what that analyst thought would happen. The chart was prepared by Moody’s Analytics, a big player who has a huge interest in figuring out what is most likely to happen, so I thought it was worth sharing with you. Here’s the chart, which is page 13 from the presentation linked at the end of this post.

Map2

This is a pretty fascinating chart. Note that some areas near us are predicted to recover to their previous highs within the next 2 to 3 years. And for some of the hardest hit areas, full price recovery may take 20 years.  Factor some inflation against that and I’m not sure it is a recovery.

In our own Greater Seattle / Bellevue area, it looks like their prediction is recovery to 2007 price levels in the 4 to 5 year timeframe at best. Still, all in all it doesn’t sound too shabby – that would be about 5% a year from here, or more like 3%/yr if it stretched out to the long side. My guess is that this recovery rate would be back-end loaded – lower (near zero) appreciation rates near term, and higher rates later on as the national economy really gets rolling again. We’ve got a lot of unemplyment to work off before that happens.

The whole presentation is linked here in the 2010 – Housing Recuperates presentation from Moody’s Fall 2009 Economic Outlook Conference. In the chart on mortgage default rates on page 10, the left axis is CLTV – Current Loan to Value Ratio; the chart is a little hard to understand unless you have that information set in your decoder ring.

Don’t get too hung up on month-to-month fluctuations in reported median prices.  As Ardell’s chart clearly shows, even with a county wide mass of data, the reported median can jiggle up or down a few percent.  Our median for the 16 months shown is about $380,000 +/-5%, or swinging about $20,000 on either side in any given month.  In January we had a nice 5% blip up in the condominium median price, but for February it was right back down where it had been most of the time for the past year.