Historically, a homebuyer first calculates how much home they can afford. They either do this on their own by calculating a % of their gross income, or they go to a lender who produces a home price “suitable” to their financial situation.
When you need a new coat, do you calculate how much coat you can afford? Sometimes, yes, if you are on a limited budget. But more often you simply buy one you like at a reasonable cost. Why isn’t home buying more like that? Probably because there is limited access to what “reasonable cost” is for a given area. Let’s take the time to study “reasonable cost” and also promote asking your agent this question: “Is the home I am buying a reasonable cost for this area, based on ALL homes recently SOLD here?” Remember, you are not asking for “3 comps”. You want to know how valid this price is for this particular area, generally speaking. In other words, you want to know if this is going to be a reasonable cost IF and when you have to sell the house you are buying.
When people are looking for a home to buy, they are mostly looking at homes for sale. They may look at homes that sold nearby “the comps”, but rarely do they look at a complete picture of what has sold vs. what is for sale.
Let’s look at how that may skew your perspective.
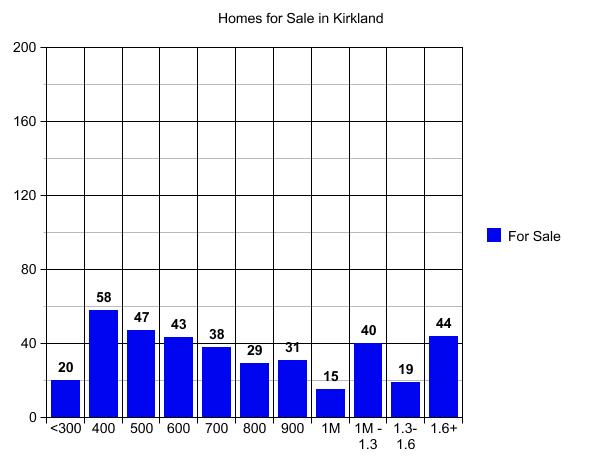
A quick study of price in Kirkland looking only at homes for sale at this time (graph above), would lead you to believe that the Housing Market in Kirkland is 60% or so under $800,000 and 40% or so over $800,000, with about 25% over a million dollars.
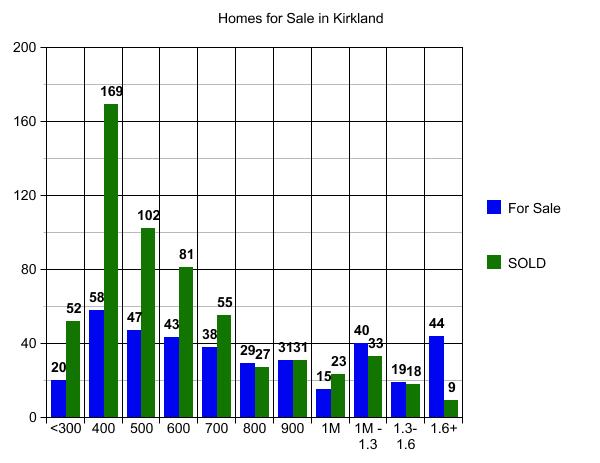
Now let’s layer in the number of homes SOLD in those price ranges in 2009 YTD (graph below). You will quickly see that 66% sold for under $600,000 vs. 60% under $800,000, and over a million is not 25%, it is more like 10% of the current “market”.
Now we get to the part my clients find MOST annoying about me. Let’s look at the home you are buying from the standpoint of you being the one trying to sell it. You cannot focus on a home’s weaknesses unless you can switch your mind from buyer to seller. Honestly, most of my buyer clients can’t do that no matter how hard they try, especially if they are first time buyers, and so I have to do it for them. But the visual below helps drive home the point that you may fail to sell this home you are buying today, even if you do all of the right things when it comes time to sell it.
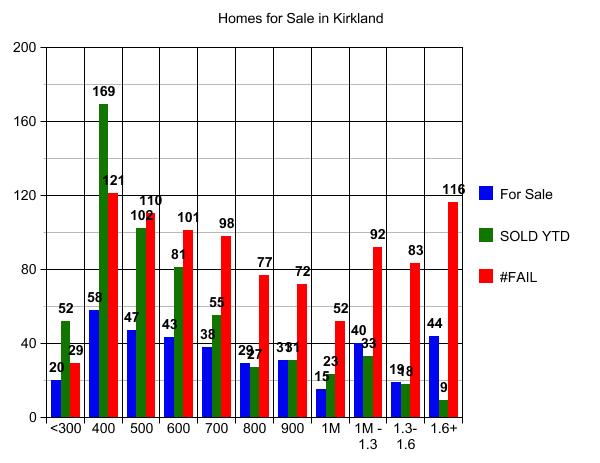
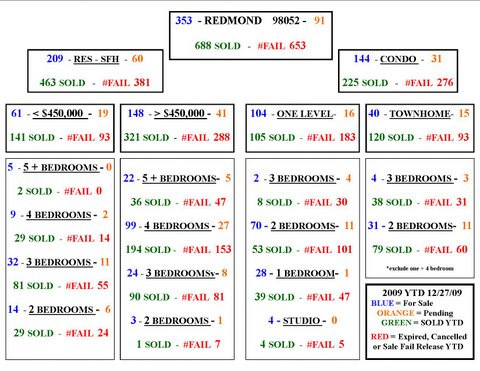
There are many ways to use this information. First I’m going to ask you to look at the worst statistic in the graph above. I know most readers of this post are not in the $1.6 million plus price range. But look at this segment so that you can more easily “get” the point, and then apply it to your price range.
Green = Only 9 sales above $1.6 million
Blue = 44 people are currently trying to sell homes above $1.6 million
Red = There were 116 Failed Attempts to sell a house for over $1.6 million in 2009 YTD
IT TOOK 116 FAILED ATTEMPTS TO SELL 9 HOMES!
ONE HUNDRED AND SIXTEEN (116) FAILED ATTEMPTS IN ORDER TO GET NINE (9) N I N E homes to SOLD!
(Funny, I just checked that for the umpteenth time because it is so startling, and now there are 10 vs. 9. Still, same point.)
Sorry for yelling, but I wanted to make sure you got that point 🙂 What is a #FAIL? It’s a cancelled, expired or “Sale Fail Release”. That is not 116 properties. One of those 9 homes that sold could = 5 or more failed attempts to sell, before it actually sold.
Only the first two price segments, homes sold for $400,000 or less, had fewer failed attempts than homes sold. That’s roughly 1/3 of all homes being purchased in Kirkland. That means 2/3rds of all home buyers will likely have a difficult time selling. The degree of difficulty increases as the price increases.
You may ask “Do all agents look at the #FAIL stats?” The answer is “used to be”. Factoring in the “Failed to Sell” properties when doing a Comparative Market Analysis became a little “old school” during the hot market. Fewer properties failed to sell, and fine tuning a home valuation prior to making an offer was not standard modus operandi. I remember a new agent coming to me in 2005 asking “Where’s the button I push to tell me the home value?” I laughed; they did not. 🙂
I was trained to note “for sale” in blue, sold in “green” (real $) and Failed to Sell in Red as in STOP! But during the hot market there was no STOP sign and no brake peddle, for the most part. Newer agents were rarely if ever taught how to use the brake peddle, nor did one come with the training.
Let’s look at why that was.
In 2001 in Kirkland, 555 homes sold at $300,000 or less with 364 #Failed attempts.
In 2004 in Kirkland, 291 homes sold at $300,000 or less with only 50 #Failed attempts.
By 2006 in Kirkland only NINE (9) homes sold at $300,000 or less and only 1 #Failed attempt.
Who could train an agent how to value a property and how to consider the #Fail rate in a market like that? Why would you? So most agents who got their license in the last 5 years have a tendency to ignore the #Fail rate. Hopefully this post, in addition to assisting buyers and sellers of homes, will also suggest to a few agents that #Fail rate is immensely important to the home valuation
There is no button to push to tell you what to do with those #Fails. Valuing a home is returning to the “art form” that it once was, with subjective consideration of the #Fails. So back to the question: What is a “reasonable cost” for the area where you have chosen to buy? It’s a combination of the price paid by the majority of home buyers in that area AND the #FAIL rate for that price.
Take a look at Bellevue, for example. One of the biggest mistakes you can make in Bellevue is getting qualified at $1.5M and then trying to find the house closest to work that fits that price. You may end up with a McMansion on a busy road. A “McMansion” is not just a big house. A “McMansion” is a big house “worth” $1.5 million, stuck in the middle of an area where 90% of the homebuyers pay $500,000 give or take for a home. Perhaps taking that same house out of there and putting it in 98004 in the right location, transforms it into a home at “reasonable cost” for that area.
I’m using a somewhat ludicrous example to make a point, but buying an $800,000 home in an area where 92% of homebuyers paid $500,000 or less, can be equally “unreasonable”. Maybe not when you are buying it, but when it comes time for you to sell it.
Take a look at these graphs of Redmond. What seems to be the “reasonable cost” there? Different people will look at that same chart and answer it differently. About half the people paid $500,000 or less. If you only want a new house, you may work up the graph to only include homes built since 2003 or so. But do your homework. Work up a graph and don’t stop at “homes for sale” as shown in the first graph in this post.
An Alternative Approach To Home Buying may be deciding WHERE you would like to live, and then paying a “reasonable cost” for that area, even if that price is much less than you “can afford”.
When you need a new fleece hoodie, it really doesn’t matter that you can afford to pay $5,000 for it, does it? You’re still probably going to pay about $100 or less for it. If you look hard enough you can probably find a fleece hoodie for $5,000, or get someone to custom make it for you. But why would you?
Required Disclosure: Stats in this post are not compiled, verified or posted by The Northwest Multiple Listing Service.

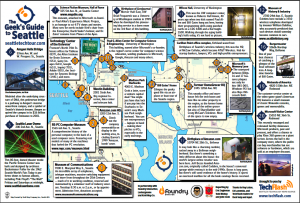
 Are you new to Seattle WA? Have you been here a while but are tired of the same old routine?
 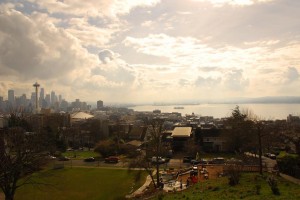 The Queen Anne Neighborhood of Seattle is amazing from all angles – on the North slope there are lovely views of Ballard & Fremont over the canal and the Fremont Sunday Market is practically right there! To the East is Lake Union with houseboats all along Westlake, the Bigelow Ave portion of Queen Anne Boulevard, Downtown Seattle views, and more. In the Southeast, the newer QFC is just one of the factors that make this part of the neighborhood score high on