2018 Home Prices in Redmond 98053

Before the graphs, time to mention that there were 572 homes sold in Kirkland 98033 last year, 625 homes sold in Kirkland 98034, 620 homes sold in Redmond 98052 compared to 352 sold in 98053. The 2 active listings at $2.5M+ are extremely large land parcels with a home on each.


More Zip Codes to follow in subsequent posts. Some will be Eastside and some will be Seattle, but only in places where I work, so mostly North of Downtown in Seattle plus Shoreline, Kirkland-Bellevue-Redmond, Issaquah-Sammamish and bit of Bothell on The Eastside.

ARDELL DellaLoggia, Sound Realty – 206-910-1000 cell – ardelld@gmail.com email

Required Disclosure: Stats in this post are hand calculated by ARDELL in Real Time and not compiled, verified or published by The Northwest Multiple Listing Service.

Related Posts
2018 Home Prices in Kirkland 98033
2018 Home Prices in Kirkland 98034
2018 Home Prices in Redmond 98052

Real Estate – Why DATA is the New Black

Early Friday evening one of my favorite long term clients asked me this question: “Why is the market so slow these days? I have an alert for ($) houses in (zip code) and I barely get a couple of hits every week west of (the freeway). Almost always tear-downs.” (actual specifics from his email removed)

My first data set pulled was a line up the number of homes sold where I primarily work (North King County – North of I-90), by month, over the last 6 years from 2009 to 2014 YTD. This to answer only the first 8 words of his question “Why is the market so slow these days?” The easy answer would be “because it is past October 15th”. I test my knee jerk response by pulling all of the relevant data to be sure I am not answering like grandma in a rocking chair pulling some now irrelevant data from her long term memory bank. I also do this because I need to discover why this person’s current perspective may vary from the long term norm.

Something may recently have happened leading this person to believe that the standard progression is no longer the realistic expectation. I value his thought process as part of how I answer the question…by first pulling the data…lots and lots of data.

The line graph below documents the data pulled for the last 6 years. But as I almost always do when pulling stats, I went back 12 years because data expires! More on that in graphs 4 and 5. Since I almost never regurgitate already documented data from other sources, but rather only trust the data if I calculate it myself, I usually go back as far as my data source will allow, which in this case was 12 years.

First I test my perception that 2014 is not a low inventory year, even though there are tons of articles saying that inventory is low. Many articles talking about the frustration of buyers with “low inventory”. But look…no…my perception is indeed correct. The red line is the “low” or at least the first half of 2009 depicted in the red line. The green line of this year is not only NOT “low”…it is pretty close to the high over the last 6 years.

To be clear, I am using “homes worth buying” as “inventory” and the proof that they ARE homes worth buying…is someone actually bought them.

Volume 2009-2014

After I peruse some of the recent data as an attempt to start at the point where he may be coming from when asking the question, I dive into my own “expert opinion” perspective, which is my 2001 baseline. This information is really already carved in my brain, but since I turned 60 this year I figure it wouldn’t hurt to double check that my memory is still accurate. πŸ™‚

Volume 2001 baseline

I actually did all 12 years before honing in on the actual answer to the question, which comes from comparing 2014 with 2013 and 2013 with both 2001 and 2005.

To determine which were the correct comparison years, I had to first pull ALL of the data that the data source would allow.

While yes…my knee jerk answer of “because it is October” would have been correct, by pulling all of the data I can see from the variance of the actual stats from 2013 against the baseline of 2001 exactly why the question made 100% sense from this person’s perspective at the time he asked it.

This person, along with every average homebuyer, is looking week to week over a period of 6 months to 18 months for a home to buy. They have no “baseline perspective”. Their expectations come from more recent history’s actual activity, and rightly so, with no way to tell if the last 6 months was exceeding or under performing standard market expectations.

The bar graph below explains where the expectation may come from. I have 2005 in there just because it is the one year over the last 12 years when the most number of homes were purchased (ipso facto “available” to be purchased), so highest inventory year. But the key to answering the question is in the 12% of June 2013.

If you look at every piece of data on this page which looks at all 12 months for all 12 years in 6 different comparative charts…12% of a full year’s total inventory being available to buy in one 30 day period is pretty much unheard of! That was June of 2013.

I had another client who started looking in early 2013 and did not buy the house they could-should have purchased in June of 2013. After that they were progressively and continuously disappointed with the number of homes that came on market for months and months afterward. They had no way to know that the volume of homes coming on market since they started looking were many more than the normal market expectation.

In hindsight every subsequent month looked pss-poor in comparison. Pretty much all activity if you started looking in April of 2013, and didn’t purchase by June-July of 2013, is looking relatively dim. BUT in reality inventory is not dim. Inventory, the number of homes you can expect to choose from, is in fact currently performing at or over market expectations adjusted weekly for seasonality. All this can be gleaned from the 12% spike in that bar graph, noting the rational explanation as to why your expectations may be “off” by comparing relatively recent actual data against 12 years of data comparisons.

Basically that makes us both right. I’m right at “because it’s October” and the person asking the question is right to consider the options dim based on more recent relative comparison.

Volume 2001-2013-2005

Posting the data and graphs that helped formulate the above. Worth noting, while I brought forward the Red Line year of 2009 to note inventory low point, the graph below shows that the 12 months of low inventory started in the 2nd half of the gold line of 2008 and proceeded to the lowest point of Jan and Feb of 2009, which some of my readers may remember as “my bottom call” that made front page news at the time.

Volume 2005-2008

Looking above and below at the thick green line of 2014 inventory against the high inventory years of both 2004 and 2005 you can easily see why all of the articles calling 2014 low…and actually they were saying that last year in 2013 as well, are simply not true.

Volume 2001-2004

While my analysis will continue to use 2001 as a baseline, you may want to use the bar graph below to set your expectations. This is the average good homes on market based on the average of 12 years worth of data.

I use 2001, as many of the variances over the last 12 years are influenced by Tax Credit Incentives coming in and out and artificial interest rate jockyings…not to mention all of the massive changes in loan approval criteria over this same period. For that reason 2001 is still the purist baseline by which to compare and contrast other market influences as they come and go from time to time.

WHY IS THE MARKET SO SLOW THESE DAYS?

Getting back to the first 8 words of the original question…because based on normal seasonal activity you can expect that there will be HALF the number of homes coming on market that are worth buying by December than in May. “coming on market” activity is the month prior to the sold month. So highest SOLD volume in June will = highest number of instant alerts of new listings coming to your phone in May.

Expect the numbers to increase from December through May and then begin a decrease through year end before beginning the next climb.

Volume 12 year average

WHY IS DATA THE NEW BLACK?

Because it saves you time and reduces your stress to DRILL down the data from the general comparisons above and fine tune your actual parameters before you waste any time looking for something that doesn’t exist in the place where you are looking. That brings us to the 2nd and 3rd part of this person’s question ” I have an alert for ($) houses in (zip code) and I barely get a couple of hits every week west of (the freeway). Almost always tear-downs.” (actual specifics from his email removed)”

Only 25 houses were sold using a full $150,000 spread with your $ amount as the cap in the whole 6 months of “high season”. So expecting 2 a MONTH in low season let alone 2 a week…is an invalid expectation. Expect ONE really good one a month from here to February of 2015.

“Almost always tear-downs” means you are looking for a nice home at the price of the land alone. Again an invalid expectation. Changing your price to what that home will sell for there is not an option. Changing your choice of what to a tear down is also not a reasonable option.

The only answer to your dilemma is to change the where and not the price or the what.

(Required Disclosure: Stats in this post are not compiled, verified or published by The Northwest Multiple Listing Service.)

Impact of Fiscal Cliff Agreement on Homeowners?

housing and fiscal cliff

There was so much fear mongering going on about “The Fiscal Cliff” it was starting to feel like being tied to a chair and being forced to watch The Shower Scene from Psycho. The stock market rallied up in response to it just being OVER WITH! But should we just be happy that it’s over with? Did the final agreement impact homeowners?

Doug Tingvall of RE-LAW sent me a quick synopsis of how the deal impacts homeowners “for now”. I asked him to post it publicly as I think it might be of interest to homeowners and homebuyers. I don’t see much in there that is alarming or even much of a change, but maybe I’m missing something. Read Doug Tingvall’s full synopsis HERE

While Doug’s Article does not seem to have a place to ask questions or post a comment, if you have questions you can post them here and I will see if Doug has some time to answer them for you.

The summary is worth a quick read and many thanks to Doug Tingvall for sending it over to us.

2012 Median Home Prices UP…and DOWN

Single Family Median Home Prices are UP 6% YOY for the First Half of 2012 in Seattle.

First Half 2011 @ $399,000 – First Half 2012 @ $423,000

Bellevue School District is the Big Winner at UP 20% with a Median Home Price of $689,000.

Issaquah School District DOWN 4%, Northshore School District DOWN 2%

Lake Washington School District UP 4%

Median Home Prices for First Half of 2012:

Bellevue School District: $689,000

Issaquah School District: $521,000

Lake Washington School District: $498,000

Northshore School District: $376,000

Seattle School District: $423,000

Northshore School District has become a pretty good buy lately, given many of the schools have shot UP in the rankings and the median Home Price is by the far the lowest in the mix.

********

Required Disclosure: Stats are not Compiled, Published, Verified or Posted by The Northwest Multiple Listing Service.

********

ARDELL 206-910-1000 Β  ardelld@gmail.com Β  ARDELL DellaLoggia, Managing Broker, SOUND REALTY

Where Should I Live?

Not every client asks me where they SHOULD live. But the question comes up from time to time, and often from family members who are considering jobs in more than one city.

I am answering a more complex one for a family member who hopes to purchase a home vs rent. Scenario is they are graduating with an RN and looking at:

Los Angeles $82,000 Salary
Seattle $74,000 Salary
Colorado $71,000 Salary

The issue when people ask me is usually whether or not the salary differential makes up for the difference in the cost of the housing in various places. The offered salary is $11,000 more in Los Angeles than in Colorado, but does that compensate sufficiently for the difference in housing cost? In the past the scenarios presented to me were about renting vs buying, and often the differential did make up for that difference in rental cost. But when someone is buying vs renting…not necessarily the case.

In this particular example I am looking at Entry Level housing, VA Loan with zero down and a family that already has two children and is planning to have more children. So I need at least 3 bedrooms on this entry level housing.

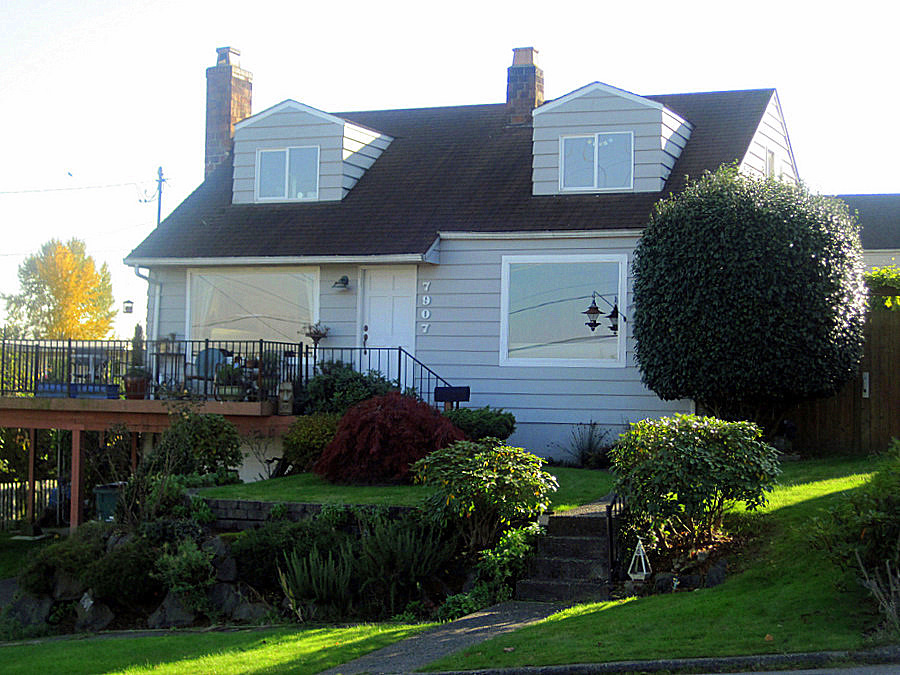
Starting with “Seattle”…I know that the person is interested in The Eastside Cities of Kirkland, Bellevue or Redmond. For this “entry level” example, I am going to use a home that closed on Wednesday for one of my buyer clients BUT putting in the loan scenario of the family member of mine who is asking the question.

141st House

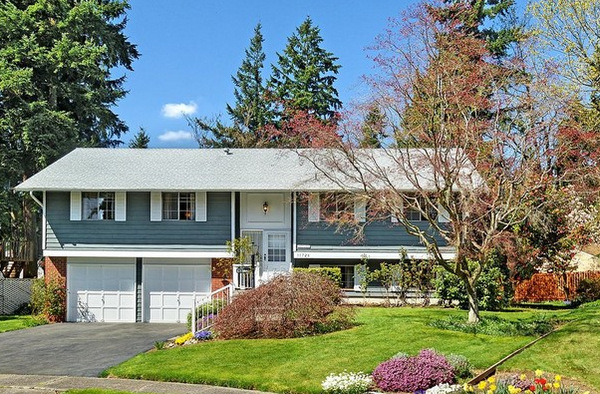
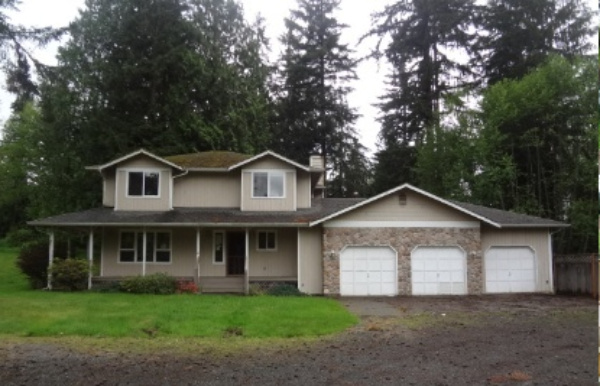
Price SOLD is $355,000. Plenty of space and yard for a growing family. Cul de sac lot. Could use some updating, but no expensive fixes needed. Had one owner for 44 years since it was built, in 1967. A good indication that a family can live there indefinitely without needing to upgrade to a larger home.

Now we’re matching this home purchase up to the above RN Salary for “Seattle” of $74,000 for the person asking the question, vs the person who actually bought it the other day.

First we’ll use the “rule of thumb” of 3 to 4 times annual income for the loan amount. That would put the loan, based on $74,000 Annual Income, at $222,000 to $296,000. A little short based on Zero Down for this home.

I’m going to move this WA scenario over to a home I sold in Mt. Lake Terrace that is a similar home, big lot, with a one car vs two car garage, but that sold for $250,000 vs $355,000. Edmonds School District. A reasonable example for Mt. Lake Terrace or Brier.

$250,000

Now we go back to our 3X to 4X Gross Annual Income “rule of thumb”. and we can fit $250,000 into that $222,000 to $296,000 equation without approaching the upper limit. NEXT we go into the actual real detail of payments, which isn’t worth doing if the Rule of Thumb = No Way, Jose.

Conservative numbers put monthly housing payment, whether that be rent or mortgage payment, at 28% of MONTHLY GROSS income. VA guidelines are usually 40/40 ratios, allowing people with no debt to put the entire debt budget on home. This Family is a Zero Down…but also a Zero Debt, so they can go somewhere between 28% and 40% as the housing payment.

I am not a Lender…so you have to check the ratios with an actual lender before making offers, but since I don’t recommend going to 40% on housing payment even if you have no debt…as you may incur debt at a later point, let’s proceed.

This family would have ZERO Closing Costs on the above $250,000 scenario as they can be included in the price with a Seller and/or Agent Credit to cover the Closing Costs entirely. So we don’t have to factor in Closing Costs on the WA scenario. That will change for the other cities.

Rates are very low today…too low to use for this scenario, so I’m going to pump the rate up to 3.75%. We are going to stack the VA Funding Fee on top of the price for Loan Amount and Payment purposes. That amount is $5,375. It can be fully or partially paid as part of the Closing Costs, but let’s assume a stack on this one taking the Loan Amount up from $250,000 to $255,375 at 3.75% is . Property Taxes are $250 a month. Homeowner’s Insurance is $50 a month.

NOTE: There are different VA Funding Fee rates for different scenarios. Putting 5% vs ZERO down can reduce the Funding Fee by almost 2%. I have used a rough scenario based on the person who asked the question. These Funding Fee rules change from time to time, are different for Refinance vs Purchase Loans, whether you were in Regular Military or National Guard and whether it is a 1st time or subsequent use of the privelege. See your local lender for specifics.

OK…back to the payment on the $255,350 Loan Amount at 3.75%. $1,182.57 for the Principal and Interest plus $250 for RE Taxes plus $50 for Home Insurance (Fire, etc.) gives us a monthly payment of 1,482.57. That happens to be pretty close to what the home would rent for, probably less than rent for this style of home in other nearby places like North Seattle or Lake Washington vs Edmonds School District. Not sure about Northshore School District, which would also be in the mix as to Bothell homes. But all in all, a good basic scenario.

Back to $74,000 Salary in WA and $1,482.57 a month housing payment. $74,000 Annual Gross Income divided by 12 gives us $6,166.67 Gross Monthly Income which puts $1,482.57 a monthly PITA at 24% of gross. At 40% of Gross Income the monthly housing allowance would be substantially more at $2,466.67. $2000 a month PITA would be a loan amount of $430,000. hmmmm.

Let’s go back to the Rule of Thumb. $430,000 is 5.81 X Annual Income vs 3 to 4 times Annual Income. Low Interest Rates do impact this rule of thumb issue, but still…going over 4X Annual Income just doesn’t look right.

Let’s go back to the first house at $350,000. That payment would be $1,679.41 plus taxes of $330 a month plus insurance of $75 a month would be $2,084.41 a month or 34% of monthly gross income. That’s really enough to spend on housing, and likely appropriate in this case as we are only using one income at an entry level salary. So the payment will become more affordable with some supplemental income from the other spouse and future raises.

So let’s say either of the above examples will work…as well as something in between.

That’s the hard part. Now let’s throw up a $250,000 home and a $350,000 home in Colorado in the Cities of preference as noted by the person asking the question.

Most Every Home in Parker Colorado fits the bill. No problem there. So Parker Colorado, even at a few thousand less in Salary down from $74,000 in WA to $71,000 in Colorado…very easy to get a house for $300,000 give or take.

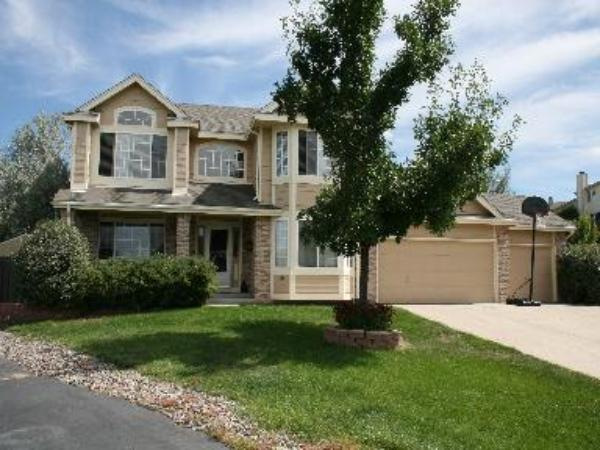
This big 5 bedroom, 3,200 sf home in Parker is listed at $314,900 and there are plenty of others to choose from. Easy to see why Parker Colorado made the list of options.

Parker

Castle Rock, another choice in Colorado, is even lower priced. This new 3,530 sf new home is listed at $288,000. But Parker doesn’t seem so far out of the way, and is plenty affordable.

Castle Rock

That’s all I can say about Parker and Castle Rock Colorado, as I don’t know the area at all. It works, so it would depend on the salary offers in the various locations. WA works. Colorado works. Now to L.A.

We have a bit more room here, as the salaries are higher by $10,000 or so as the average. Using the same 34% of Gross I used above vs the 40% allowance, and using $82,000 as Gross income is $2,325 for housing payment. Let’s use $1,900 after taxes and insurance. That gives us a home price of $400,000 allowing the extra $10,000 for VA Funding fee on top of the mortgage.

What does that buy in L.A. in the specific areas of interest?

It doesn’t buy us anything in Walteria, one of my favorite not too Ritzy places. πŸ™

It doesn’t buy us anything in Redondo Beach, even when I throw in 3 bedroom condo-townhomes.

There are a few in NW Torrance that would work, but they are short sales, so not sure if that price is reflective of “the going rate” for the area.

This 3 bedroom 2 bath, 1,468 sf home at $365,000

This house looks nice, but you can see a huge electrical tower behind the house.

Obviously L.A. is not as doable as WA or CO, so the salary difference would have to be higher. If the salary offer in L.A. was double that of WA and CO…well we can revisit this. But for a small difference…may not be worth it.

Let’s find an L.A. house and work the salary backward.

Well…I can’t find any for sale BUT the GOOD NEWS is I did find a few in Redondo Beach that SOLD. So the answer is there are a few…but the sell very quickly.

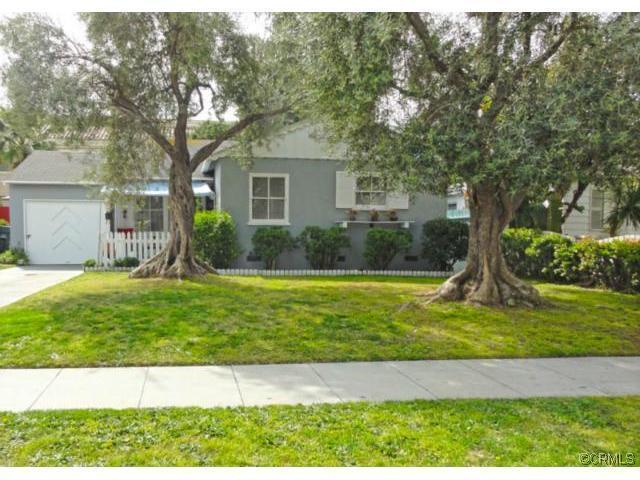
This one sold for $419,000. It’s only 914 sf though. 3 bedroom, 1 bath, but small. Nice sized lot and yard though…and it is warm and sunny enough to be outside most of the time year-round, unlike WA and CO.

Redondo Beach

This 3 on a lot sold for $410,000. Nice Street. 1,612 sf with 3 bedrooms and 2.5 baths.

BOTTOM LINE: All three are potentially doable…enough so to put out resumes in all three areas and see what kind of offers come in. WA is probably the best option for several reasons. L.A. is doable IF the salary offered is high enough…OR…if you rent for a bit until the salary improves by raises. Parker vs Castle Rock is probably an excellent option. Depends on how close to the actual work site they would be.

The purpose of answering the question “Where Should I Live?” is not to really answer the question, but to give some food for thought. There are some other considerations like schools and safety, but I already know the not Colorado options well enough to factor that in and the Colorado Cities seem to have pretty much ALL good schools. There are a couple of exceptions in Castle Rock, and I still prefer Parker for several reasons, but most Castle Rock Schools are pretty darned good except for one or two.

Shooting this link to the person who asked the question. Hope it helped someone else with the general “thought process” and work through format. No matter where your thoughts travel as to “Where Should I Live?”, it’s not to hard to do a comparison based on Salary Differences and Home Price differences. The cheapest homes are not always the best choice…nor is the highest salary.

Of course I’d have to say WA vs CO, but to compete, I’d have to throw in a nice looking house for $350,000 in Duvall. πŸ™‚

duvall

Seattle 4/3 Cape Cod with a View

Some time ago I wrote about Seattle Starter Home Styles and we talked about the value of having bedrooms up above the main floor vs down in the basement. While that would describe most any 2-Story home, before we get to 2-Story we have the one and a half story “Starter Home” Style. This one happens to be a Cape Cod…
Lakeridge front-2

with a view.

Lakeridge 3-1

I am reminded while listing this property of The Tim’s comment of another home featured over on Seattle Bubble:

“The listing agent claims that the home’s architectural style is β€œCape Cod,

Ardell’s Seattle Area Real Estate Blog – Most Visited Posts

It amazes me sometimes, which of my posts garner the highest readership. Dustin tracks the “per post” stats for Rain City Guide and shows us which garner the most eyeballs…from time to time.

I was looking at the numbers over on my blog, which likely gets a fraction of the activity as my writings here. But once in awhile I get surprised by a single post getting over 20,000 views…for just one post. Usually they are posts that spark an interest nationally vs primarily local here in “The Seattle Area”.

Here are the blog posts with the most views, not necessarily in the order of highest to lowest:

Sex and Real Estate – AKA What’s Cooking in the Master Bedroom?

How is a Real Estate Transaction like a Pregnant Woman?

Negotiating Real Estate Commissions

Should I Buy a House Now? (Amazing how this post from Summer of 2008 is still equally as relevant today.

For Buyers Who are Relocating to Seattle – The Yes, No, Maybe tour method

Split Entry Homes and the different names they are called around the Country.

Ardell’s Anatomy of a Real Estate Transaction which is the older and longer version of This Year’s “From Contract to Close of Escrow”, written here on Rain City Guide.

What Does a Real Estate Agent Do?

Is your townhome a condo or a single family home?

Do I need to Sell My House before I Buy a New One?

Home Sales Way Down October 2007

Who do you make your Earnest Money check payable to?

The Appraisal in the Home Purchase and Sale Process

Sample Closing Statement – HUD 1 I posted the link to the source I now use vs my original post, given there have been changes over time. I used this the other day for a client who is closing in January. You can plug in the estimated numbers and save it and email it. It’s a very good idea for buyers and sellers to see these numbers on the form they will be signing at closing, as early in the process as possible.

Kirkland Real Estate Stats as of Today (that “today” was a long time ago. I’m doing the 2011 stats now. Will be interesting to do them on the same basis for comparison purposes, with the same type of charts.

Pottery Barn Paint Colors and other tips on your Seattle Home

Homes “Sold” by Ardell DellaLoggia – a running and updated catalogue of homes where I represented the Buyer or the Seller, noting which I represented for each home.

Real Estate – Delusional Sellers or Delusional Buyers?

New on Market! Do you jump on it…or let it pass?

That’s really the biggest question in Real Estate today in the Seattle Area. You hate everything that is for sale, but when a house comes on that you like (and so does everyone else) how do you know whether or not you would be overpaying to be the one that buys it in less than 7 days?

Everyone’s talking about the crazy market of no one wants it or everyone wants it. C’est la vie! Knowing when to jump and when to pass is an artform in its fine points. But since everyone can’t be an artist, I try to come up with some “rules of thumb” to help you with the “pass or play” dilemma.

A few weeks back we talked about the main three steps of finding the right house using the internet. In this segment we will expand on Step 3 which helps you determine what to offer and whether or not to offer at all.

I started using a color coded system for valuation models early this year. Not necessarily to help me value property, but as a way to show others how and why an agent will walk up to one house and say “they are asking too much” and the next one “hurry and get this one before someone else does”. It’s near impossible to define that because agents tend to learn these things by osmosis vs actual data. But if you don’t know the client well, you have to find some way of conveying the “why” of that, and this is the best I could come up with for the moment.

Works fairly well if you don’t leave your common sense at home.

A for instance…I coincidentally just got an email from an agent while typing this about a “massive” 10% price reduction…and it is still WAY overpriced! How does an agent or a buyer know this instead of thinking WOW…big price drop? How do you know that it is still 20% overpriced after a 10% price drop? Well, maybe one that obvious is a secret to no one. πŸ™‚

Back to color coding…
value color codes

Red is the universal STOP! Brown is the universal “This might be a load of crap”. Yellow is the Universal “CAUTION!”. Everything else is where most property should fall from light green to dark blue being “the norm” depending on the area and the house. Purple is reserved for Royalty, meaning the house AND the location better be pretty darned “special”.

Now you chart out your area of interest noting not only the Market Value to Assessed Value Factor, but also how much of the value is represented in the DIRT of it, vs the HOUSE of it. Bring your common sense with you…the tax assessor is not always correct. Well, he/she is “correct”, but the market may not agree. So you have to adjust for market influence as to home styles, condition and changing influences on land value. Don’t make them up though…make sure you find the evidence to support your adjustments in the current data.

Your charts should look something like this for In City and most View Areas:

Lakeview 600-650

OR like this for a more typical “suburban” housing development:

98052 2011

More charts with explanations here and here and here, as you want to lay the correct ground work before working on Who is DELUSIONAL, you or the seller?

SELLER IS DELUSIONAL EXAMPLES:

I’m pulling up real examples as I type this. I can’t tell you which houses they are, because it’s against mls rules for me to shine a flashlight on delusional sellers by name and address.

1) Seller lives in the 1.1 or less area and has priced their house at FIVE TIMES the Assessed Value. Yes folks…it’s a new listing too. Lots of oddities here…let’s move on to less delusional.

2) Seller prices the house at 1.4 in the Brown Zone in an area that normally sells in the light blue zone. This is one where the Tax Assessor may be off. If you can get it into the dark blue zone, you may have to be happy with that. There’s a strong chance it will sell in the purple zone, and it should have been listed in the mid range of the purple zone at no more than 1.35 X assessed value. For my clients I’d say if you can’t get it for 1.25 X AV or less…let it pass. Why is the seller “delusional”? Because he spent a ton of money remodeling the kitchen. BUT that was 25 years ago. It needs to be done again.

3) OMG this house has been on market SO long…it must have a pile of dog poop in the living room when you walk in. How can a house be on market for almost 3 years! OK…listed at 1.28 x AV in a neighborhood that sells for 1.06. No dog poop…just overpriced. They have reduced the price over 3 years to the current 1.10 X AV…too little too late and close but no cigar. The stigma of more than 2 years on market is going to push this down into the green zone. On the bright side everyone else in the neighborhood is selling their house in 2 to 7 days, because by comparison, even though they are only priced fairly, they look like screaming deals. LOL!

4) Oh Jeez. This one is just sad. Nice house. Great house even. On market almost a year. Great area, well “good” area anyway. The problem isn’t so much that it is priced at the wrong MV to AV factor. It is priced at FIVE TIMES THE VALUE OF THE LAND! Holy Crap, Batman. a BROWN price in a GREEN neighborhood. Sad really. The only way it can ever sell is as a short sale, and that won’t likely be anytime soon. Watch for this one to go off market or be on market for 2 plus years.

5) This is a nice house on market for almost 2 years. What’s wrong with it? Switching to “Bird’s Eye View”. What the heck is that? Built between a huge condo complex and an industrial park within a stone’s throw of the freeway. The assessor knows that’s a no no, but the seller is ignoring the assessor and priced it at…wait for it…1.36 x AV and the house is in the parking lot of an industrial property! Let’s try .96 x AV on that one.

OK…enough on delusional sellers.

Let’s look at the houses that sold in less than 7 days.

1) Nice house in a 1.15 to 1.2 neighborhood but a smallish house with only one bathroom. Listed at 1.06 x AV sold the first week at full price. Maybe a little underpriced, but with only one bathroom…worked out for everyone. No surprises here.

2) A nice clean house that needs remodeling in a great neighborhood that normally sells at 1.2 x AV. Listed at 1.06 x AV. Sold in less than a week.

3) This one looks like it went too high. Obsolete home style, great staging but needs remodeling. 1.1 area. Listed at oh no…1.57 x AV RED ZONE and sold in 5 days. That should have been a pass. That’s what we call “hope you plan to die there” cause no one else is going to pay 1.57 x AV for that!

4) Here’s one in a primo Seattle neighborhood that usually sells for 1.25 x AV. Sold in 5 days at 1.23 x AV even though it was listed at 1.15 x AV. People are more likely to make the mistake of overpaying in Maple Leaf than Green Lake or in Ballard than Queen Anne, if you no what I mean. The fine nuances of value become most important in areas that border high prices, but don’t command them, like example #3 above.

I’m not going to go look for a 5th example here, but I will say that looking at all of the houses sold in even less than 7 days, hard to find any that sold over asking, and those that did were not over by a significant amount. Example #4 was likely the largest sold to asking price example.

Now let’s not forget about the Delusional Buyers.

1) Walk into the nicest remodeled house in a neighborhood that sells easily at 1.2 x AV on a bad day and want to get the house for .80 x AV. Then they complain there are no good houses for sale “at a good price”. Do your homework. Check every sold property in the last 3-6 months and chart everything. IF the areas sells for .80, like parts of Duvall, well…I have it labled yellow for “caution”. You probably want a 1.2 for 1.1 or a 1.1 for 1 or even a 1.1 for .95 if you can get it. I did a 1.1 for .85, but we did proceed with caution…and a structural engineer as well, and that was Winter. Learn to “look a gift horse in the mouth” when appropriate.

2) Wants to pay the same price per square foot of all of the sales he didn’t want to buy…for the house he does want to buy. If you didn’t like them, you already know they were worth less. Don’t complain that you lost the house you finally found. Make sure you highlight on your charts the bad houses and the good houses and offer the good house factor when you find a good house. Don’t hate all the 1.1 houses and then expect to get a great house at 1.1.

Don’t leave your common sense at home. 2011 is the Battle of the Delusionals and the survival of the fittest.

Home Prices Recover in Kirkland 98033

Many around the Country are asking what a Home Price “Recovery” will look like and what will create it. If you have been home shopping on The Eastside close to the 520 Bridge, you are likely amazed at the strength of that market in recent weeks.

Kirkland 98033 is not the only market experiencing this phenomenon, as I first noticed the activity and price increase in the Cherry Crest neighborhood of Bellevue 98005. But since I recently represented a buyer client who closed on a home in Kirkland 98033 near Downtown in the Lakeview Elementary School area about a block from Google, I am focusing on this area first.

While back in October and for the 4th Quarter of 2010 we were talking about whether home prices in King County overall were running in late 2004 levels or early 2005 levels,

Kirkland 98033 has bounced up to February 2006 levels!

Before you jump to the conclusion that this segment simply had a lower % of Short Sales and Bank Owned Property…not so. A full 42% were “distressed” properties. Even with that drag of an additional 5% to 6% down created by the “distressed property sales”, the prices are running at February 2006 levels.
kirkland 2011

None of us are holding our breath for prices to reach peak levels, and I don’t anticipate that happening for many years. But if you chop off the extreme peak of 2007, home prices in 98033 are clearly recovering nicely.

WHY?

There are several contributing factors.

1) Googleopening in 98033 in late 2009 and hiring a significant number of people in recent times.

2) High Elementary School Rankings – While all of the schools in 98033 don’t enjoy the highest ranking status, those closest to Google and Downtown Kirkland do. Peter Kirk Elementary, Lakeview Elementary and Ben Franklin Elementary, all in 98033, help support and boost home values in these areas. To be fair and balanced, I did not segregate these schools in the stats and included all school areas of 98033, at least one of which ranks fairly low.

3) Anticpated 520 Bridge TollThe soon to be imposed Toll to cross the 520 Bridge has had an impact on home prices closest to that Bridge. Some have moved from Seattle over to the Eastside to avoid the Toll. Some who work on the Seattle side, but prefer Eastside Schools to Seattle Schools, have moved as close to the Bridge as possible to cut down on fuel costs and time delays to compensate for the negatives of the toll.

Kirkland is clearly one of the best places to live in the Seattle Area, and always has been, especially the area closest to it’s Downtown on the Lake. The reasons for that are many, and the subject of another post.

So yes, the Recovery is clearly “Cherry-Picking”.

A few other amazing facts. Of the 44 homes sold in the First Quarter of 2011 in 98033 that were NOT short sales or bank-owned properties, 18% sold in ONE WEEK or less with 23% selling in two weeks or less and a full 50% selling within 90 days. Clearly though the distressed properties were very high at 42%, they were not creating a huge drag on the non-distressed properties. The median for non-distressed properties was a whopping $646,000. Very close to the full median price of 2006 overall.

This is what a “Recovery” looks like. It doesn’t reach peak…but…it looks pretty darned good to homeowners in 98033.

********

(Required disclosure: Stats in this post are not compiled, verified or published by The Northwest Multiple Listing Service.)

How to find your “Dream Home”

Finding your Dream Home starts with determining if you can afford your Dream Home. Let’s say you have decided that you want a two story house, one with at least 3 bedrooms on the 2nd floor. Now add that you work at the main Microsoft Campus and want a home within a reasonable distance to work.

Start by taking out a map and drawing the area within which you would like to live. For the purpose of this example, I drew the map based on where most of my clients who want to live near Microsoft draw these lines. For example, most wouldn’t live on Finn Hill, so Finn Hill is not in this sampling. Most would not live in Bothell. So Bothell is not in this sampling. I can’t use a “radius” of the campus, as most don’t consider the other side of Lake Sammamish to be better than a little “further” in pure distance into Kirkland vs “around” the Lake. So I’m using a polygon, many sided, map area.

Your “mapped area” may vary, but use this as a guide, and apply to your own mapped area.

I’m using a “12 month rolling basis” here to include the most recent data and exclude the oldest data, and yet still have enough sales in the sampling to produce enough relevant data. For the most part it is 2010, but includes the most recent data available in Jan. 2011 to date, and excludes the oldest info from Jan of 2010.

Before you go out looking at houses, you want to begin with some reasonable expectations.

graph (26)

The Data above tells us that the majority of two story homes in the mapped area sold over the last 12 months existed in zip codes 98052, 98033 and 98004. Now let’s look at price.
graph (28)

I only used some of the data to produce this post. You can see the rest of the raw data HERE.

By using these simple techniques, you can easily see that you likely need to spend about $650,000 give or take and look in 98052 and 98033 primarily. But what if you want to spend $500,000 and want a home that is not older than 5 years.

Simple…just test that parameter.

98052 2-story built in 2006 or later sold in the last 365 days for $500,000 or less = one house.

98033 there was also only one house sold fitting those parameters, but it was far from being finished new construction. There is also one in pending. Both required cash buyers as the property was not in a condition that could be financed.

So now you have to ask yourself, is “The Dream” a “house” or a “home”? Do you change the “what” and look for an older home of a different style in a great neighborhood with a great school? Or do you up the price in order to get everything you want, if you can afford it, but didn’t “want” to spend more than $500,000?

Point is, you don’t have to go out to “look” for your Dream House before testing your Dream against Reality. Setting a realistic objective saves you time and maybe money as well. By staying home and making this decision, you may opt to keep the price low and change your expectations as to house. If you get too vested in the outcome of “newer 2 story house of not more than 5 years old”, you may start pushing on price to get “it”.

Consider all of the factors of “dream home” including neighborhood and schools, before getting your heart set on one particular style or age of home.