Lessons from the Foxhole: A Nevadan Takes a Stab at Seattle’s Real Estate Future

joe salcedo[Editor’s Note: I get asked all the time if people from outside of Seattle can write for Rain City Guide and I always say no… I really like keeping RCG as a “Seattle” thing. However, recently Joe Salcedo of the Reno Real Estate Blog reached out to ask if he could publish a one-time post on RCG about his experiences with the Reno, Nevada market and the insights it might provide to the Seattle community… and I bit. I’ve published the article below. Enjoy! ~Dustin]

In August of 2005, our real estate market crashed.   It’s been five years and we’re slowly trying to get back on our feet.  I’m here to share some of the lessons I’ve learned along the way; the prodigal brother, if you will.

I started with a blank page.  One weekend after, baffled and fascinated and my curiosity violently piqued, here’s what I found out about your market:

  • If you waited until Seattle home prices went down in July 2007 (before you realized the market was having problems), you’re going to be at least one year behind.  Check for other signals. Home prices take too long to reveal itself profitably.

In Feb 2006, less than a year after the Reno real estate market crashed, I called an emergency meeting (coupled with other factors like plunging housing starts and declining home builder stocks) after being greeted by this chart:
Reno Home Resales
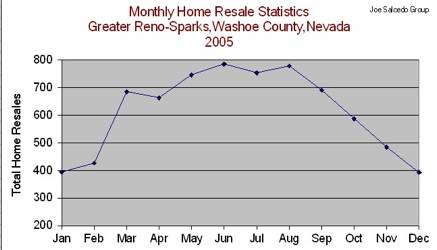
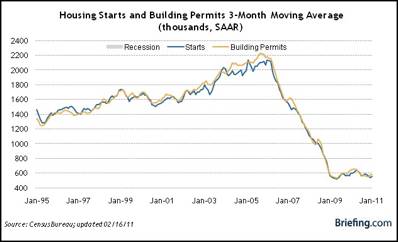
Yes, all markets are local but we all came from our mother’s womb.  Like a bearish stock market pulling down three out of four stocks with it – (both weak and strong companies) – majority of real estate markets fall with the general market.   Follow the home builder sector group in the stock market (Investor’s Business Daily tracks it every Monday). Check housing starts and building permitsto see a glimpse of the future:
Housing Starts Chart

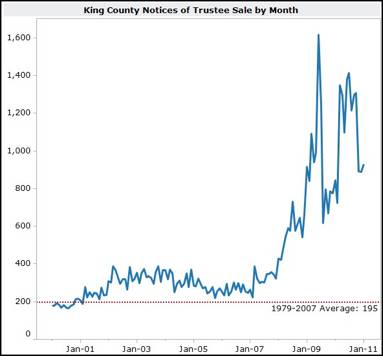
  • For potential sellers: Consider cutting your losses short.  If you’re barely making it with house payments (perhaps using borrowed money just to make it) and hoping that the market would change soon, perhaps it’s time to think about making some tough decisions.  Distressed properties tend to pull home prices down further (see: notice of trustee sale graph below.)

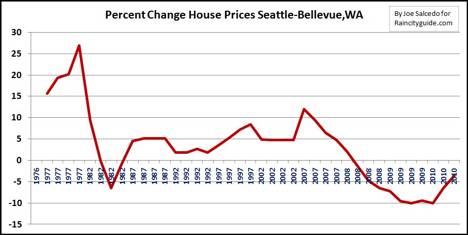
If you’re comfortable with your mortgage payment (you bought a house on or before June 2005) and moving is too painful, it’s ok to stay; just know that based on present real estate conditions, it may take a few years before your house will appreciate from the price you bought it.

Percentage Home Price Change

Notice of Trustee Sale by Month Chart

(From SeattleBubble.com)

  • Short sales and foreclosures are like a mysterious disease that defies normal market cause and effect.  Inventory could be down, demand up, but price still down.  This has been happening in our market since 2007.

And like your resident queen, the author has made premature bottom calls by not taking into account the “black swan

Are We Facing A Housing Shortage?

In looking at the latest Northwest MLS statistics for King County, it would be tempting to say that our housing market is recovering.  But it is an odd mix of data.  Single family home sales volumes are up (even better than last year), inventory is down sharply from last year, prices seem to be starting to rise again, and average days-on-market is dropping.  That all sounds pretty good.  (larger residential stats charts)

Residential stats 750

(Note that the Northwest Multiple Listing Service neither prepares nor is responsible for these charts – the interpretation is my own.) 

But condominium sales are still slow (though rising some), inventory is staying high, and median prices are not rising.  That doesn’t sound quite as good.  (larger condo stats chart)

Condominium stats 750

What are we to make of this seemingly conflicting data?

 What it looks like to me is that we are in the early stages of a housing shortage.  While Seattle and the west side have been built out for decades, Bellevue and the east side communities have been absorbing most of the region’s growth for the past 50 years or so.  But we passed the Growth Management Act in 1990, and then we added the Critical Areas Ordinances.  As a result, it has become harder and harder to get permits for housing developments of any significant size.  In fact it appears that over the last 10 years or so it has become far easier to get a permit for a 100-unit condominium high-rise than for a 100-home residential development.  The rate of application for new building permits “fell off a cliff

The Buyers are out, and trying to buy, but…

Buyers are out, and trying to buy, but they don’t seem to be quite as successful as some of the more breathless news reports would lead you to believe.  I have always liked the Pending Sales statistics from NWMLS because they represent the most recent monthly snapshot of new contracts on listed properties – i.e. a Buyer and a Seller have made a deal.  But recently a lot of those ‘deals’ have not closed, the Seller has not gotten his or her money, and the Buyer has not gotten possession of the property. It appears that a lot of these current transactions, which are indicating a high level of Buyer’s intent to purchase, are falling out or being delayed for long periods.

Here is a chart built from NWMLS published statistics of Pending vs Sold data – the chart is built by taking a two-month moving average of Pending (previous month) vs Sold (current month) data. Note that this post expands on an earlier post by Ardell in her Sunday Night Stats.

Let’s call this chart the Fall-Out Ratio – we may want to keep an eye on it.

(Required disclaimer: Statistics not compiled or published by the Northwest Multiple Listing Service)reilingteamcom-fall-out-ratio-0906

Historically the fall-out rate has been well under 10%, but then in early 2008 the fall-out rate started climbing like a rocket. Recall that we had the mortgage market meltdown in late 2007, and lenders started dramatically tightening their lending practices. Then we had the larger financial and business crash in late 2008, and more people started losing their jobs – and the other 90% got nervous. It was also in late 2008 that we started seeing a lot more short sales in our Seattle/Bellevue area. Recall that in a short sale, the insolvent seller is trying to avoid foreclosure by selling the property and getting the lender to accept less than is owed on it. That lender approval process is often slow and uncertain, and it certainly is contributing to this rise in the Fall-Out Ratio. Short sales may be 20% or more of our current sales activity, and those delays may also be a major contributor to why the average Days-on-Market measure isn’t dropping in concert with Months Supply. Other contributors to the fall-out rate would include failure to reach agreement on inspection, and failure of financing. I’m sure we’ll get a lot more insight on causes from the comments by our great RCG contributors.

Sunday Night Stats – 2008

The charts and graphs will pretty much speak for themselves tonight.

The Median Price Per Square Foot chart above shows medians for each Quarter from 2004 though 2008. You can see the nose dive in prices during the last quarter of 2008.  Popped right through 2006 prices into 2005 year end prices. I expect to see prices come up a bit during the higher volume months of 2009, and then trend back down toward year end.

What are “the higher volume months”?  See the volume graphs below comparing 2008 with 2002.  2002 was the most stable year, prior to zero down loans coming into fashion in late 2003.  There will likely be more late postings for December closings, but the relationship of each piece of the pie is more important than the individual numbers.  “stable market” equals larger slices near the bottom of the circle than at the top and a fairly equivalent ratio.  We did not have that in 2007, but we did in 2008 and likely will see the same in 2009.  2009 will either be fairly similar to 2008 as to volume, or moving a little closer to 2002 volume.  It depends on what happens at the high end of the market.

Current volume is lower than 2002 for two reasons.  One – financing is tighter, as 5% down and 10% down was much easier to get in 2002. Two – financing jumbo loans is very difficult right now, and in 2002 only 412 homes sold for over a million dollars.  In 2008 there are 2,338 homes asking more than a million dollars, of which 942 sold, 79 are pending and 1,317 are for sale as of tonight.

If we do see 4.5% interest rates, I expect many who can, will buy.  But that won’t help the high end as too many people just don’t have the downpayments the lenders are looking for. The year ended up pretty much where I predicted it at $400,000 as to median price, give or take fifty bucks.  Volume was a little lower at 15,700 vs. my prediction of 16,500.

Enjoy the graphs…they speak volumes.

Here is a running list of posts with charts and graphs tracking the market that I have written back to 2006.

Statistics calculated by ARDELL and not compiled or posted by NWMLS (required disclosure)

Sunday Night Stats – Seattle Real Estate

Median price per square foot for condos sold is starting to fall below 4th quarter of 2006 numbers, and is down 11.8% from peak pricing. 

King County Condos

2004 – 1Q – 1,694 – $188, 2Q 2,636 – $199, 3Q 2,540 – $196, 4Q 2,176 – $195

2005 – 1Q – 2,066 – $198, 2Q 2,925 – $209, 3Q 2,769 – $226, 4Q 2,266 – $224

2006 – 1Q – 1,956 – $242, 2Q 2.748 – $252, 3Q 2,737 – $269, 4Q 2,217 – $278

2007 – 1Q – 2,042 – $295, 2Q 2,862 – $302, 3Q 2,676 – $311, 4Q 1,618 – $294

2008 – 1Q – 1,258 – $299, 2Q 1,535 – $287, 3Q to date 895 – *$274


Active Listings: 3,983 – DOWN 47 – median price $319,950 – MPPSF  asking $307 (Down $3) – DOM 67 (up 2)

In Escrow:  804 –  UP 10- median asking price $289,700  – MPPSF asking $291  – DOM – 53 (up 3)

Sold YTD :  3,710- UP 650 – median list price $289,000 – median sold price  $282,450 – MPPSF – $287 (down $2) DOM 49  

Residential King county

2004 – 1Q 5,650 – $152, 2Q 9,237 – $160, 3Q 8.737 – $163, 4Q 7,467 – $165

2005 – 1Q 6,402 – $173, 2Q 9,093 – $185, 3Q 9,131 – $192, 4Q 7,301 – $195

2006 – 1Q 5,596 – $201, 2Q 8,248 – $214, 3Q 7,771 – $216, 4Q 6,204 – $217

2007 – 1Q 5,304 – $222, 2Q 7,393 – $230, 3Q 7,944 – $229, 4Q 4,301 – $221

2008 – 1Q 3,640 – $219, 2Q 4,676 – $220, 3Q to date 3,106 – *$215

*Residential median price per square foot is down another $2 per square foot since I ran the numbers two weeks ago.  That brings prices back very close to where they were in the 2nd Quarter of 2006.

Some sigificant changes for property in escrow.

In Escrow: 2,429 – DOWN 139- median asking price $409,950 (down $10,000) – DOM 51 (up 3) – MPPSF $197 (down $7)

SOLD YTD: 11.451 –  Actively for sale 12,027 – DOWN 280

Sold Year to Date and currently for sale are getting very close.


Stats not compiled or published by NWMLS. (Required disclosure)

Sunday Night Stats – King County

We’re just past the halfway point on the third quarter, and condo prices are getting much lower.  Unless we see a major change in the next 5 to 6 weeks, the MPPSF is showing down over 11% from peak At $274 vs. $311.  Not a big surprise, as pending stats have been low, so it was only a matter of time before those low numbers in pending status started showing up in the closed sales.  Still I wouldn’t be surprised if they bounce up a little by the end of the 3rd Quarter.

Inventory is getting pretty darned flat.  For condos the number of properties for sale hasn’t changed much since May.  3rd week of August – 4,082, July 3,958, June 4,049, May 3,953.  Pretty much flat for four months in a row.

I’m not even going to talk about pending sales as there is so much junk stuck in there and not closing.  For now I’m not counting anything until it actually closes.

King County Condos

2004 – 1Q – 1,694 – $188, 2Q 2,636 – $199, 3Q 2,540 – $196, 4Q 2,176 – $195

2005 – 1Q – 2,066 – $198, 2Q 2,925 – $209, 3Q 2,769 – $226, 4Q 2,266 – $224

2006 – 1Q – 1,956 – $242, 2Q 2.748 – $252, 3Q 2,737 – $269, 4Q 2,217 – $278

2007 – 1Q – 2,042 – $295, 2Q 2,862 – $302, 3Q 2,676 – $311, 4Q 1,618 – $294

2008 – 1Q – 1,258 – $299, 2Q 1,535 – $287, 3Q to date 685 – $274

Residential properties seem to be holding on to value a little better than condos, but still showing more weakness now than they have since late last year.  MPPSF is only down 5% – 6% from the peak of $230 to current numbers of $217, and we may not see much of a change in those numbers by the end of the 3rd quarter.

Inventory in the single family markets has flattened out a bit, but only in the last 30 days or so.  Some of that is being caused by people renting instead of selling or pulling their properties off market to wait for next Spring.

Residential King county

2004 – 1Q 5,650 – $152, 2Q 9,237 – $160, 3Q 8.737 – $163, 4Q 7,467 – $165

2005 – 1Q 6,402 – $173, 2Q 9,093 – $185, 3Q 9,131 – $192, 4Q 7,301 – $195

2006 – 1Q 5,596 – $201, 2Q 8,248 – $214, 3Q 7,771 – $216, 4Q 6,204 – $217

2007 – 1Q 5,304 – $222, 2Q 7,393 – $230, 3Q 7,944 – $229, 4Q 4,301 – $221

2008 – 1Q 3,640 – $219, 2Q 4,676 – $220, 3Q to date 2,366 – $217

Stats not compiled or published by NWMLS. (Required disclosure)

As is true most years, the prices will start to be better for buyers from now through year end.  In the hot markets of the past few years, that only meant that appreciation would slow down.  But this year and last year, the prices just kept getting better and better…for buyers that is.  If you can wait a year or two, I think prices will be even lower.  But if you plan to buy in the next 6-9 months…the next 3 may be better than waiting just a few months longer.

Sunday Night Stats – More signs of stability

King County Home Sales

King County Home Sales for the last 8 years, the only time July volume was higher than June homes sold was in 2003. That 2008 is lower than 2007 is old news. The good news is that the relationship of sales month to month is following a predictable pattern and a normal relationship.King County Home Prices

King County Home Prices June and July

King County Home Prices June and July

Same as to prices.  Even in the boom years, the relationship of prices from June to July was pretty much the same as it is now.  Prices are running slightly above where they were this time of year in 2006.

Both of the above graphs are for King County Residential (not condo).  The question isn’t whether or not August will be down, but whether it will be down in a normal relationship to June and July.
The text is centering and I can’t stop it 🙂  Since it’s almost 1 a.m., I will do the regular weekly stats in the morning and post a link here.  I was more interested in end of July stats.  A few more will trickle in for months, so I’d say July was not a bad month overall.
Stats not compiled or published by NWMLS (required disclosure)

Sunday Night Stats – Where's the market heading?

Tonight I want to get an idea of where the market is heading as we go into July, as to prices.  I’m going to bulk together some Zip Codes that I personally follow, to have a large enough area to be meaningful, and yet zero in on local at the same time.

I’m getting the data as I am typing, so I have no idea how the numbers will fall.  We’ll find out together.

First Group: 98033, 98052, 98004, 98005, 98007 and 98008 on a combined basis.

Residential:

In January of 2008: median Asking Price of homes sold was $652,450 and the median Sold Price of those same homes was $625,000.  Median days on market of those sold homes was 68 days and 27.66% sold in 30 days or less.  Median Price Per Square Foot = $267.66

Lets jump to May 2008 and see where the market went by that time from the beginning of the year.  Median Asking Price $643,500.  Median Sold Price $630,000.  Median Days on Market 41 and 38.28% sold in 30 days or less.  Median Price Per Square Foot = $272.72

June 2008: median Asking Price $710,000.  median sold price $690,000. Median days on market 61 and 33.58% sold in 30 days or less.  Median Price Per Square Foot = $277.10

July month to date: Median Asking Price $650,000.  median sold price $639,000.  Median days on market 50 and 30.92% sold in 30 days or less.  Median Price Per Square Foot = $253.57.  Median type of house was a 4 bedroom 2 1/2 bath 2,520 sf home.

Some pretty large homes are in escrow with the median square footage of all homes in escrow at 2,660 and a medain price per square foot of $262.20.  Of course that $262.20 is asking price and not sold price, so prices are trending down from July 1 to present.

Let’s compare that to June of 2007: Median Asking Price $699,000.  Median Sold Price $685,000.  Median days on market 21 and 61.09% of homes sold in 30 days or less.  Median Price Per Square Foot = $292.73.  Median type of house was a 4 bedroom 2 1/2 bath 2,340 sf home.

Interesting July stats so far.  The size of home is larger, the price is lower.  More home for less money as I said last week.  Very Interesting.  But the numbers are so different from May and June. Fewer houses sold quickly.  This data is worth tracking week to week, especially as we head into fall.

Second Group Seattle 98115 and 98103 on a combined basis excluding townhomes (townhomes on Eastside automatically not included for the most part, as on The Eastside townhomes are condos and not residential). Trying to keep this apples to apples.

In January of 2008: median Asking Price of homes sold was $540,000 and the median Sold Price of those same homes was $522,500  Median days on market of those sold homes was 51 days and 29.57% sold in 30 days or less.  Median Price Per Square Foot = $253.64

Lets jump to May 2008 and see where the market went by that time from the beginning of the year.  Median Asking Price $595,000.  Median Sold Price $580,000.  Median Days on Market 20 and 61.97% sold in 30 days or less.  Median Price Per Square Foot = $277.51

June 2008: median Asking Price $550,000.  median sold price $546,000. Median days on market 29 and 54,02% sold in 30 days or less.  Median Price Per Square Foot = $265.04

July month to date: Median Asking Price $567,450.  median sold price $553,450.  Median days on market 23 and 56.90% sold in 30 days or less.  Median Price Per Square Foot = $261.67.  Median type of house was a 3 bedroom 1 3/4 bath 2,115 sf home.

Let’s compare that to June of 2007: Median Asking Price $567,000.  Median Sold Price $569,500.  Median days on market 13 and 75.93% of homes sold in 30 days or less.  Median Price Per Square Foot = $273.79.  Median type of house was a 3 bedroom 1 3/4 bath 2,080 sf home.

The median asking price of all pending sales is $535,000 and the median square footage is 2,085.  Looks like better “deals” are in escrow as we speak at $256.59 MPPSF as to ASKING prices with that number to be pared down further as to sold prices.

Stats not compiled or published by NWMLS. (Required disclosure)


Unless someone asks for the regular weekly King County Stats, I’ll post them over on my blog tomorrow.  It’s been a long, back-breaking day for me.  I was more interested in finding out where the market was heading, than posting overall King County since last Sunday.  But I will post them on my blog tomorrow for the benefit of those who have been charting them on Excel Spreadsheets.

Goodnight!

*****************

You can find the regular weekly stats here.

Sunday Night Stats – King County

I started working on some June YOY stats over on my blog, but I think I’m going to give it a few more days to make sure all of the June closings are posted before making any comparisons over here besides the regular stats.  It is a holiday weekend, and I’m sure more than the normal amount of June 30 closings may be posted next week.

So far it looks like June 2008 residential sales in King County were 44% less than last year and 56% less than the high as to volume, and prices are slightly down both on a price per square foot basis and median sale price,  Condos also down a little over 50% as to volume both from last year and from the high, but while median price per square foot is down, median prices are up as is the median size of condos sold in June.  Instead of spending less, condo buyers are opting for getting more square footage at that lower price per square foot, and spending more to get the larger units.  Likely a move toward being able to hold longer.

I’ll do some 1st and 2nd quarter comparisons and 1st half YOY in a few days when I’m sure the majority of June 30 closings have been posted.  For now let’s update our regular weekly stats.  Inventory is down this week (selling faster than they are coming on market) in both the condo and residential categories.

King Couny Condos

2004 – 1Q – 1,694 – $188, 2Q 2,636 – $199, 3Q 2,540 – $196, 4Q 2,176 – $195

2005 – 1Q – 2,066 – $198, 2Q 2,925 – $209, 3Q 2,769 – $226, 4Q 2,266 – $224

2006 – 1Q – 1,956 – $242, 2Q 2.748 – $252, 3Q 2,737 – $269, 4Q 2,217 – $278

2007 – 1Q – 2,042 – $295, 2Q 2,862 – $302, 3Q 2,676 – $311, 4Q 1,618 – $294

2008 – 1Q – 1,258 – $299, 2Q 1,485 – $286 (2Q postings as of 7/06/08)

Changes in condo stats for this week

Active Listings: 3,958 – DOWN 89- median price $319,990 – MPPSF  asking $319 – DOM 64

In Escrow:  870 –  DOWN 43 – median asking price $295,000  – MPPSF asking $298  – DOM – 49

Sold YTD :  2,777 – UP 132 – median list price $292,000 – median sold price  $287,900 – median PPSF – $291 DOM 49  Note: only 35% selling in 30 days or less.

Residential King county

2004 – 1Q 5,650 – $152, 2Q 9,237 – $160, 3Q 8.737 – $163, 4Q 7,467 – $165

2005 – 1Q 6,402 – $173, 2Q 9,093 – $185, 3Q 9,131 – $192, 4Q 7,301 – $195

2006 – 1Q 5,596 – $201, 2Q 8,248 – $214, 3Q 7,771 – $216, 4Q 6,204 – $217

2007 – 1Q 5,304 – $222, 2Q 7,393 – $230, 3Q 7,944 – $229, 4Q 4,301 – $221

2008 – 1Q 3,640 – $219, 2Q 4,558 – $220 (2Q  – postings as of 7/06/08)

Changes in residential stats for this week

In Escrow: 2,760 – DOWN 103 – median asking price $435,495 – DOM 49 – MPPSF $209

SOLD YTD: 8,315-  UP 407- median asking $449,950 – median sold price $440,000- DOM 49 – MPPSF $218  Note: Only 36% selling in 30 days or less.

Actively for sale 11,903 – DOWN 284- MPPSF <$800,000 is $220- MPPSF >$800,000 is $336

Stats not compiled or published by NWMLS. (Required disclosure)

How are condo/home sales being financed?

I don’t know about you, but I’ve been chomping at the bit to know how people who are buying, are financing these purchases.  It’s a monumental task to wade through the detail on this. I probably should have waited a week to get all of the September closings into the mix from the last few days.  But I just couldn’t wait another day!  The suspense was killing me. 

I used all sales from one city on the Eastside, closings from 8/1 through end of September, purchase prices of $400,000 or less.  For confidentiality reasons, since I am revealing mortgage data, I will not name which city I used.  Too easy to trace some of these to the actual purchaser.  I think it will be important to track over the next 6 months, how these percentages change, particularly with regard to FHA and financing for purchases with less than 20% down.

Here are the results of approximately 60 closings. Another 25 or so did not have the data recorded yet as to the mortgage amount and type.  I’ll pick those up in the next analysis.

1) 41.5% were 20% down or more.  Most exactly 20% down. 

2) 25% were 100% financed. Interesting note: 75% of the ones with 100% financing were done as ONE loan.  No second mortgage. So PMI may be back in a big way.  (private mortgage insurance instead of a high rate 2nd mortgage, for the amount financed representing over 80% of the purchase price.)  unless these programs waived PMI.  In any event, one loan and not two, as has been customary for quite some time now.  Big shift.

3) 15% were 10% down.  75% of those were also done as one 90% loan and not two, as in 80% and 10%.  Again…big shift.

4) 10% were 5% down.  Half done as one loan, and the other half done as two loans.

5) 5% were cash purchases.

6) 3.5% were FHA.  The amount financed on these were both 98.4% of sale price, and not 97%.  Important to note, as we tend to say that FHA is 3% down, but it really doesn’t work quite that way in reality.  One was sale price $274,000 with a financed amount $269,766.  The other was sale price $213,000 and financed amount $209,709.  More like 1.6% “down”.  I vaguely remember this from “the old days” but time for everyone to get up to speed on FHA and review some actual closing statements regarding how FHA really works at the end of the day.  While only 2 of 60 were financed using FHA, we should be seeing many more of these.  So we all need to get a lender in to explain FHA financing to the agents, in minute detail, with real closing statements as samples, NOT GFEs!

The under $300,000 market looks good with a 3 month supply in escrow…but something tells me a lot of these won’t close, due to financing, unless a lot of agents get up to speed on how to finance these really, really FAST!  Inventory also looks OK, with less than twice that amount on market, but if we can’t close out those in escrow, there’s not much hope for the existing inventory either, especially if 2/3rds of those in escrow come back on market…which they easily could.  I say at least 1/3 of these will not close.  I’m thinking it will actually be half to 2/3rds that will not close.  Mainly because in escrow represents three times the average per mo. that closed in the last two months!  So my guess is that many of these are in closing date extensions, trying to figure out how to finance.

The key to the next six months will be everyone getting totally up to speed on FHA and FAST!  If the low end can’t move in the first quarter, because agents don’t understand FHA or alternative financing, 2008 is in big trouble.  Old saying: “As goes the low end (in the 1st quarter), so goes the year.”

I’m pushing all of our agents in that direction, to help the industry and consumers.  Focus on the low end and totally “get” how to finance it, for people with little money down.  The better we handle this, the better the market will be.  Every broker should be having seiminars on FHA and minimum down financing, and not waiting to see how the market does without our influence.  The best agents need to go down to the low end price-wise, and focus on helping this market move, and not leaving the cheap seats to those least qualified to juggle the financing piece of this low end market.

Fewer sales failing on financing in the under $400,000 market will be THE key to Seattle’s holding on to its preferred market position nationally.  Don’t let Seattle down.  Roll up your sleeves and get down there where it really matters.  The first time buyer market.  DO NOT leave that market to inexperienced newer agents, without a lot of support.

It’s a darned shame escrow can’t intervene and help with this too.  Not a good time for them to be “neutral parties”.  They are the ones with first hand knowledge of which lenders are closing, and which aren’t.  I’ll give you a few clues:

Bank of America closed about 20% of the zero down, one loan, 100% financing.

Wells Fargo closed about 15% of the zero down, two loan 100% financing.

Countrywide, First Horizon, American Mtg Network, Choice Lending, Gn Mtg LLC, Mortgageit Inc., Planet Financial, Mtg. Network Svcs., Liberty Financial, Rainland – all of these closed one or more those 100% financed in the last 60 days.  FHA – Wells Fargo.

I’m not recommending these lenders, and don’t even know many of them.  Just reporting who seems to be getting the job done.  I’ll try to pick up the last week of September, those not yet updated in the County records data, in a week or so.