Hope for Short Sales in 2013 – Congress is Working to Extend COD Income Tax Exemption

This is not legal advice.  For legal advice, consult an attorney, not a blog.  Furthermore, the post below addresses some BUT NOT ALL issues relating to foreclosure, short sale, etc., and the following analysis is cursory and not complete.  If you face a foreclosure or are considering some alternative, you should obtain legal advice.

US-GreatSeal-Obverse.svgThe Senate Finance Committee recently approved extending the Mortgage Forgiveness Debt Relief Act through 2013.  That’s GREAT news for anybody interested in a short sale here in Washington.  If you’re wondering why…

Generally speaking, the IRS considers as income any forgiven debt (Cancellation of Debt, or COD, income).  For example, if I borrowed $50k from you, that would not be “income” subject to taxation because, while I received $50k from you, I had a corresponding liability to you in the same amount.  But if you then released me from that obligation and forgave that debt, at that moment I would have realized $50k in “income.”  Therefore I would need to report this “income” — the amount of the forgiven debt — on that year’s federal income tax return (and of course pay taxes on it).

In 2007, as the housing crisis was getting underway, Congress passed the Mortgage Forgiveness Debt Relief Act.  This act allows homeowners to avoid COD tax liability on debt that was incurred by the purchase of a principal residence.  In other words, if the property is your principal residence, then you will not face income tax liability on the forgiven debt.

Here in WA, there is debate about the COD tax implications of a non-judicial foreclosure.  The vast majority of foreclosures in this state are of this variety.  In a non-judicial foreclosure, the difference between the funds paid at the foreclosure auction and the amount owed is extinguished as a matter of law.  In other words, following a non-judicial foreclosure, the owner/debtor neither owns the house nor owes any money to the bank, regardless of what was paid for the property at auction.  Accordingly, some — but not all — experts believe that a non-judicial foreclosure does not create COD tax liability.

The Mortgage Forgiveness Debt Relief Act expires December 31 of this year.  Thus, if the act is not extended, effective January 1 any forgiven debt, even on a principal residence, will be considered as income and taxed accordingly by the IRS.  Here in WA, the only possible exemption to this liability is the argument that a non-judicial foreclosure does not create COD tax liability.  Thus, an owner/debtor subjected to foreclosure at least has an argument that he does not have COD tax liability after a non-judicial foreclosure.

But a short sale?  As it stands now, beginning January 1 any owner who sells short and is released from the debt will have to report that forgiven debt as income.  There is no question that debt forgiven as part of an approved short sale is subject to COD tax liability absent the “principal residence” exemption.  In other words, only a confused or misinformed owner/debtor will seek a short sale beginning January 1 given the substantial tax implications.  For example, if your house sells for $300k but you owe $400k, you will have to report $100k as income, resulting in a tax bill of an additional $30k or so (depending on your tax bracket).  Is a successful short sale worth that kind of money owed to the IRS?

But — and getting back to where we stared — good news is on the distant horizon.  Recently, the Senate Finance Committee approved extending the Mortgage Forgiveness Debt Relief Act through 2013.  While admittedly a very small step, it is at least a first step towards exending this income tax exemption.  And absent such an extension, short sales will become far, far less attractive.  If Congress can complete the job — a very big IF — then short sales will remain a viable alternative to foreclosure.  But if Congress sits on its hands and lets the exemption expire, short sales will likely dry up dramatically.  Or at least they should…

Is King County at 2001 or 2005 price levels?

Was reading the questions in the comments over on The_Tim’s post about “The Bottom Falling Out on the Low Tier”. That prompted me to run some numbers on two cities in King County. One of which is moving more solidly back into the low tier…and quickly. Another that has been in the high tier since before prices started increasing dramatically in the credit boom years.

Before I post the data, I think we should strike the tiers of 2001 and 2011 based on all Single Family Home sales in King County only, since Case-Shiller tiers are based on a different set of criteria. For this purpose I remove single and double wides, houseboats and townhomes and deal only with detached single family homes. I am using the first 5,000- homes sold in each of those years to set the tier values, since my home calculator stops at 5,000 homes. For 2001 that is the 1st quarter sales. For 2011 that is through the end of April.

2001

Low Tier – < $216,000
Mid Tier – $217,000 – $310,000
High Tier – $311,000+

with median of high tier at $400,000

2011

Low Tier – < $274,000
Mid Tier – $274,000 – $447,000
High Tier – $447,000+

with median of high tier at $614,000

For those wondering why these Tier Pricings are so very different from Case-Shiller numbers, it’s because Case-Shiller combines King, Pierce and Snohomish Counties. These are for King County only. ALSO, I’m pretty sure Case-Shiller uses resale (matched pairs) and pretty much excludes New Construction entirely, and a lot of Redmond’s story and the high price tier story is in that New Construction.

The dramatic change in the median price of the high tier tells us A LOT!

Obviously based on median prices, King County is no where near 2001 levels, BUT the following data is a bit startling.

graph (16)

Redmond running a hair under 2005 median home price, but no where near 2004 median pricing. Federal Way on the other hand quickly degenerating toward 2001-2002 pricing.

Of course once you have some more information…you have to keep going to determine the why of it. “Why” never has ONE standout answer…but the mix of foreclosures is clearly a BIG part of the story.

2011 fwr

I remember reading a question on a general forum asking why a person can’t find a foreclosure home to buy in their area of preference, when all the news stories are pointing to the DELUGE of foreclosures? Well, ZOMG! that snapshot of the market above “tells a story…don’t it?” to quote Rod Stewart.

Now compare that to 2010 and you will quickly see why the Bottom Tier is pulling away…and getting HAMMERED!

2010fwr

The % of Foreclosures and Pre-Foreclosures (short-sales) in Redmond has barely changed. Federal Way? Well…maybe they have no place to go but up? Certainly hope so.

Now let’s look at the HUGE decline in Price of Bank Owned Property 2010 to 2011. This is going to knock your socks off.

Sorry…have to throw this in as a link over. The chart won’t load.

The short of it for people who don’t like to click on links is that the Bank Owned Solds in Federal Way not only jumped UP from 28% of total sales to 47% of total sales, but the median price of those Bank Owned sales declined from $191,000 to $156,000. WAY below 2001 pricing, and with the volume of them, they dragged the median overall sold price down from $246,000 in 2010 to $199,000 YTD 2011. Maybe it will swing back a bit by year end. But Holy Caboley!

As you will also see in that link, Redmond Bank Owned solds did not change much at all as a % of total sales, BUT the median price of those dropped from $475,000 to $330,000. Still…not enough of them to impact the overall median sold price much in Redmond.

Redmond is easier for me to explain, since I don’t work in Federal Way. Let’s see if I can get another graph to load up. WordPress is liking graphs better than Raw Data Charts.

age

I combined these two so you can see the dramatic difference. Homes Sales in Redmond are being bolstered by the fact that a LOT of new and newer homes are being sold. You may see that change dramatically in 2012 as the builders seem to be shifting over to Sammamish due to the fact that they have used up a lot of the available land in Redmond.

To some extent the shift will move from 98052 to 98053, 98074 and 98075. But will the buyers shift with them? Probably yes, unless there are a lot more newer homes on resale in 98052 to compete with the travelling builders. You may say there are still plenty of newer resale homes in 98052, but track that against school rankings, and you will see what is happening there with regard to Elementary Schools.

So the drastic decline in Redmond Bank Owned Sold Price from 2010 to 2011 has a lot to do with the % of homes that are, or more aptly said WERE, newer homes. It looks like the glut of spec home leftovers here and there were pretty much sucked up in 2010 when 80% of the Bank Owned Sales were NEW…built since 2005…and most never lived in. Those empty new homes, some completely finished…some not so much especially as to landscaping, are pretty much gone.

Scanning at my notes here (my desk looks like the whacky professor after doing all of these stats on scribbles before processing them into charts and graphs) I’m seeing that the total # of foreclosed properties in Redmond 2011 that were built prior to 1980 are equal to the total # of foreclosures in 2010 of which 80% were built after 2005.

So the decline in price of foreclosed homes in Redmond (as noted in the link above) has more to do with the AGE of those homes, than a drop in prices.

Why the big drop in price in Federal Way? Age of homes does not seem to account for that. I don’t work in Federal Way…so it’s not as easy for me to read reality into the data there, as it is for me in Redmond. My best guess is that it is a degenerating market…like a cancer growing…each new set of foreclosures running off a discount of the current median price. Each new wave of foreclosures dragging that median price down due to sheer volume…and the downward spiral is feeding on itself.

Will be interesting to see if any of this swings back into place by year end. My gut tells me 2012 is going to be a wild ride. Looks like Federal Way has no place to go but up, let’s hope so.

Redmond on the other hand is likely going to lose a lot of that huge support from the new construction homes over to Sammamish, unless we start seeing a whole lot more newer home resales coming on market. That may also be good news for people in Redmond who have been trying to sell their built prior to 2000 homes. I have a feeling it will.

I just don’t see all of the Redmond buyers running over to 98074. Some, yes. Relocation Buyers, yes. But for the most part, either sales volume is going to plummet…or people are going to starting getting a whole lot more interested in some of those older homes that have been languishing on market during the new construction surge up on Education Hill. Probably a little of each.

More graphs and data on the above HERE, HERE and HERE. The last one helps you track the median price for these two cities in each year since 2001, so you can see the rise and fall to and from peak.

(Required Disclosure – Stats in this post and it’s graphs and charts are not compiled, verified or published by The Northwest Multiple Listing Service.)

Lessons from the Foxhole: A Nevadan Takes a Stab at Seattle’s Real Estate Future

joe salcedo[Editor’s Note: I get asked all the time if people from outside of Seattle can write for Rain City Guide and I always say no… I really like keeping RCG as a “Seattle” thing. However, recently Joe Salcedo of the Reno Real Estate Blog reached out to ask if he could publish a one-time post on RCG about his experiences with the Reno, Nevada market and the insights it might provide to the Seattle community… and I bit. I’ve published the article below. Enjoy! ~Dustin]

In August of 2005, our real estate market crashed.   It’s been five years and we’re slowly trying to get back on our feet.  I’m here to share some of the lessons I’ve learned along the way; the prodigal brother, if you will.

I started with a blank page.  One weekend after, baffled and fascinated and my curiosity violently piqued, here’s what I found out about your market:

  • If you waited until Seattle home prices went down in July 2007 (before you realized the market was having problems), you’re going to be at least one year behind.  Check for other signals. Home prices take too long to reveal itself profitably.

In Feb 2006, less than a year after the Reno real estate market crashed, I called an emergency meeting (coupled with other factors like plunging housing starts and declining home builder stocks) after being greeted by this chart:
Reno Home Resales
Yes, all markets are local but we all came from our mother’s womb.  Like a bearish stock market pulling down three out of four stocks with it – (both weak and strong companies) – majority of real estate markets fall with the general market.   Follow the home builder sector group in the stock market (Investor’s Business Daily tracks it every Monday). Check housing starts and building permitsto see a glimpse of the future:
Housing Starts Chart

  • For potential sellers: Consider cutting your losses short.  If you’re barely making it with house payments (perhaps using borrowed money just to make it) and hoping that the market would change soon, perhaps it’s time to think about making some tough decisions.  Distressed properties tend to pull home prices down further (see: notice of trustee sale graph below.)

If you’re comfortable with your mortgage payment (you bought a house on or before June 2005) and moving is too painful, it’s ok to stay; just know that based on present real estate conditions, it may take a few years before your house will appreciate from the price you bought it.

Percentage Home Price Change

Notice of Trustee Sale by Month Chart

(From SeattleBubble.com)

  • Short sales and foreclosures are like a mysterious disease that defies normal market cause and effect.  Inventory could be down, demand up, but price still down.  This has been happening in our market since 2007.

And like your resident queen, the author has made premature bottom calls by not taking into account the “black swan

How To Better Use the Internet to Find a Home

1) Make a “value grid” of the area you are interested in.

2) Overlay an Elementary School ranking grid (whether or not you care about schools).

3) Use steps 1 and 2 to define your “target area” and make a new chart highlighting Market Value’s relationship to Assessed Value in that smaller, defined area.

Before I demonstrate how to apply these techniques, some insight on why I am writing this post today. It is in response to a few comments I read in The Wall Street Journal’s article on Buyer frustration, namely:

“The mood among buyers was ‘nasty’…customers just keep getting outbid on the houses they want.” Glenn Kelman, CEO Redfin

“What’s selling is the Cream of the Crop, and they sell fast. What isn’t The Cream of the Crop is getting hammered.” Real Estate Agent in Florida

“It’s a false buyers market. If you think prices are cheap, wait until you start making offers.” 32 year old home buyer

The main reason you want to start your home search on the internet, is to formulate some strong opinions about what you DON’T want, especially with regard to over-paying for a home, before you step into the arena.

The tug of war in the Internet Home Game is that agents want you to just come OUT and SEE the house, hoping you will fall in love with the house, and not care so much about it being a “good value”. The homebuyer is refusing to GO SEE the houses that indeed might create this scenario, which will work out better and best for the agents and sellers than for the home buyer.

The Mexican Standoff is created by sellers pricing based on their house being somplace where it is NOT, and buyers making offers based on some overall market statistic that may or may not apply to the WHERE they want to live.

To demonstrate this technique I am using the City of Kirkland in the example, because it is one of the easiest to break down into its value segments.

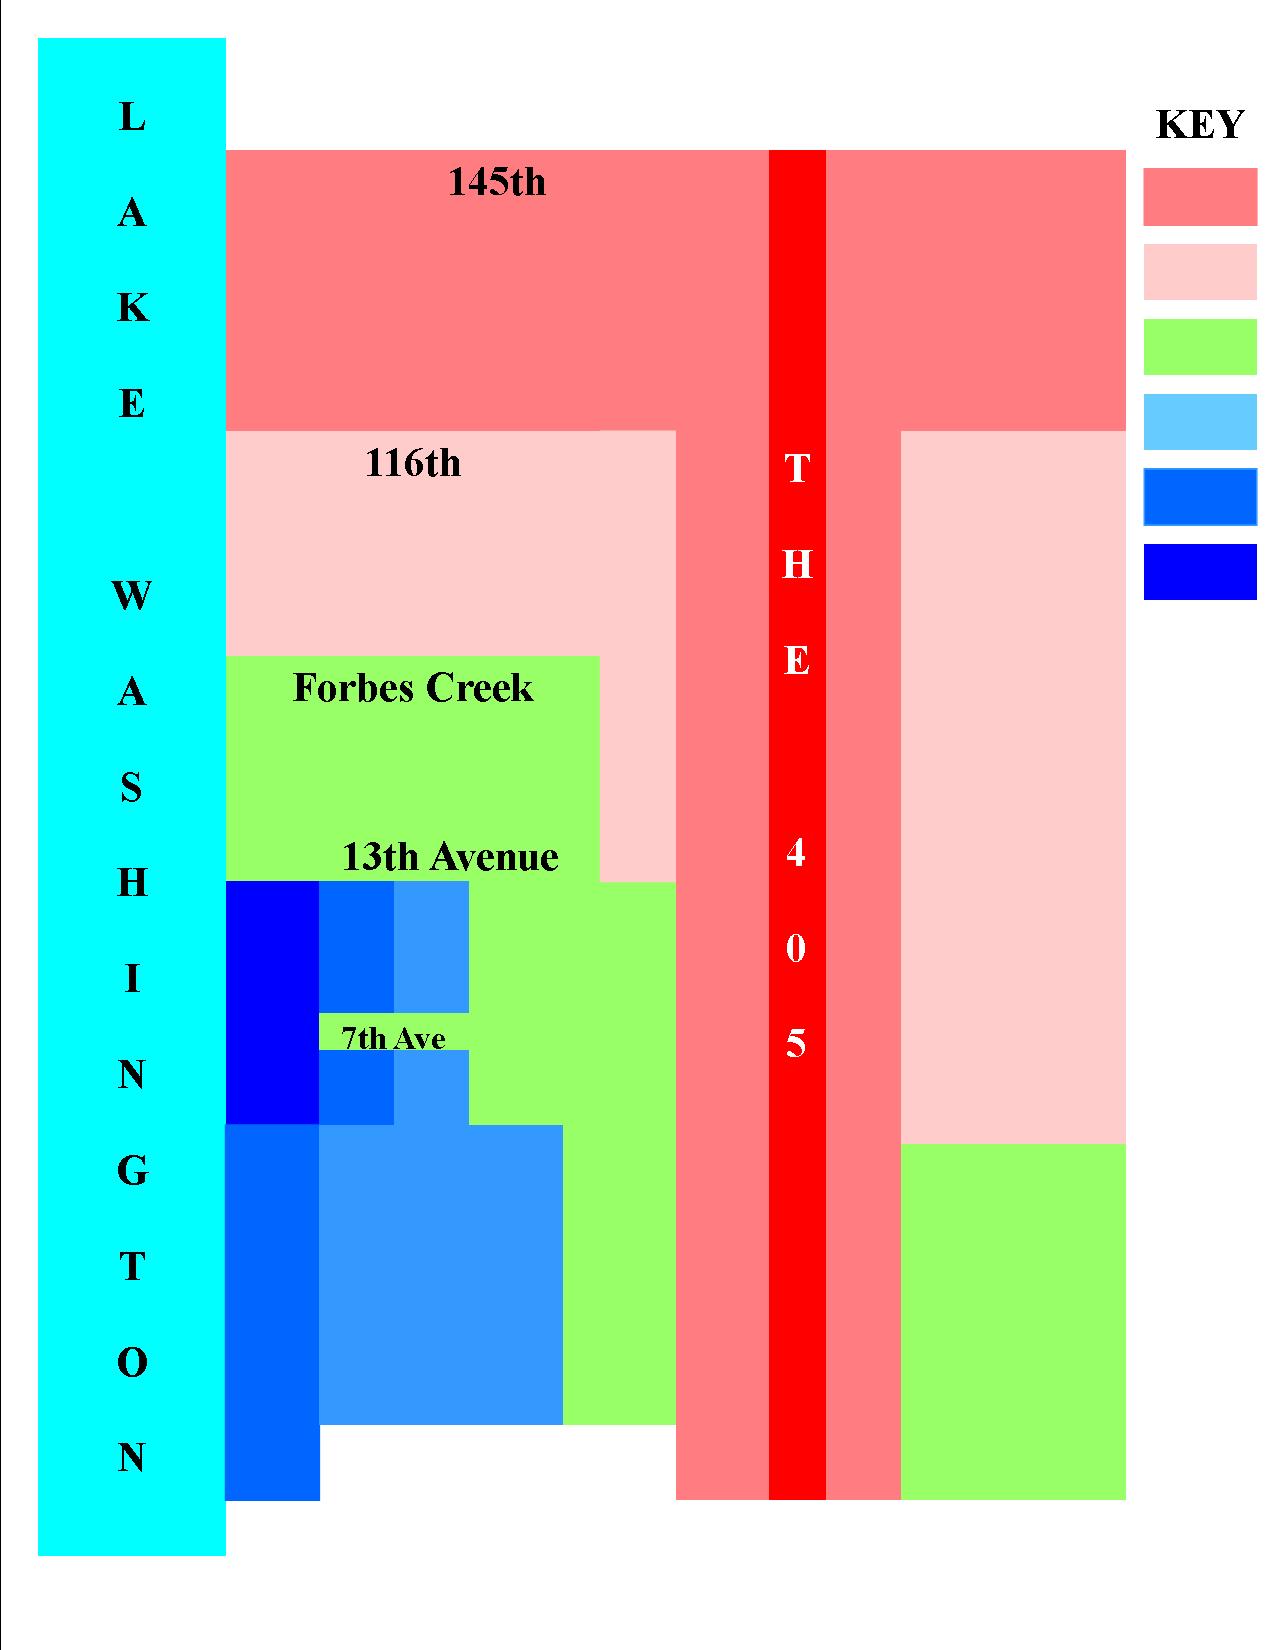
VIP! EVERY area has these VALUE TIERS with sellers in the dark pink area trying to price like the light pink area and sellers in the light blue area trying to price in the dark blue area.

That is what “over-priced” means, to a large degree.

WARNING: Some severe Real Estate Transparency ahead. Agents generally do not convey this information publicly because it can be offensive to buyers and sellers in the lesser value tiers. While all good agents use these methods with their clients, there is good reason why they do not speak of these things publicly.

If you are a homeseller or agent who wants to pretend that the only factors are school DISTRICT and those that relate to the home itself, this is not a good post for you to be reading.

1) A “VALUE GRID” example
kirkland value grid

TO UNDERSTAND AND CREATE A VALUE GRID, YOU HAVE TO UNDERSTAND WHAT THOSE VALUES ARE PULLING TOWARD AND AWAY FROM.

This is likely the main argument for why you need “a good agent” unless you can use these techniques to represent yourself. This is why having “any” agent is not necessarily better than representing yourself. When I ask an agent what “his service area is” and he says “ANYWHERE!”, I know he is not a “good” agent.

It is great to keep up on general market conditions, using sites like Seattle Bubble that tend to speak in terms of COUNTY stats. I read it all the time. BUT if you don’t take all that a step further into your area of interest, you will be the poor schnook who bought the house in the green section at a medium blue price and ended up selling it at a light pink price.

That is something that you need to understand about FORECLOSURES and why agents pay less attention to them being a “market value” setter. Sure, if someone buys a house in the green section and prices it at time of sale in the green range of value and it ends up in foreclosure, we all sit up and take notice! BUT, but, BUT when we see the house that sold for a medium blue price in the green section come back as a foreclosure…we say…”poor schnook, who the heck represented him when he purchased THAT!”

That’s how an agent can sometimes tell that a house is overpriced before seeing the house. That is why you need to know that too…so that you don’t fall in love with it and start ignoring “the obvious” from an emotional standpoint. The same holds true for the opposite, however. MANY BUYERS ARE FRUSTRATED because they keep making pink offers in the blue area…unsuccessfully. To go back on the quotes from The Wall Street Journal article, the “Cream of the Crop” is BLUE in all of its 3 shades and then Green. Getting “hammered” are the greens who bought at blue prices or the pinks who bought at green prices.

This applies to New Construction Foreclosures as well, and the builders who got the land in the green sections, but penciled their profit numbers out on the blue ones, or who bought in medium blue thinking they could get dark blue prices.

A few notes on the Sample Value Grid. I don’t want to get bogged down in the detail of “Kirkland”, but to help you use this principle elsewhere, worth a little more comment. The dark blue section is basically a condensed form of West of Market. Once you know this, you will understand why a lot of the bargains are up at 18th Ave to 20th Ave, especially on the West side of Market Street. The Medium Blue section to the right of the dark blue section is the other side of Market Street known as “The View Corridor” of East of Market which runs from 1st STREET to 3rd STREET (but not ON 3rd) and from Central to 13th Ave. The lighter blue section to the right of The View Corridor is East of Market up to 6th Street (but not ON 6th Street). The green section to the right of that is called “the wrong side of 6th” and can turn pink and green alternately depending on which street. Lots of “bad” decisions on highest priced homes “on the wrong side of 6th”. Same holds true in the lower sections where 6th Street turns into 108th Ave NE. You have to balance the COLOR grids (and school grid) with the “freeway noise” in some of these areas on the southern portion of the grid in the blue and green areas.

The lines are not hard and fast, but understanding some basic valuation principles will help you understand “value” better and well enough to “bend” the lines when appropriate.

AGAIN…EVERY AREA HAS THESE COLOR GRID FACTORS!. They just differ as to where and why in each area.

********

2) Overlay the ELEMENTARY SCHOOL GRID

This is a newer value increaser/inhibitor somewhat created by sites like GreatSchools.org and sites like Redfin using those rankings on its property detail pages down near the bottom. People always had a word of mouth “best schools” impact on home values and rankings of School District and High Schools. But the valuation demarcations based on ELEMENTARY school and the exact “borders” of those schools, is a relatively new phenomenon created by more information being available on the internet.

Knowing the school boundaries is great! But are we giving too much credence to sites like GreatSchools.org and SchoolDigger.com? Most real estate industry personnel say yes, and do not lend their seal of approval to these sites as readily as some newcomers to the industry. That said…there is some overlap between the school rankings and the traditional value segments. Most BLUE areas happen to have good schools. Some pink areas do as well. So to do our overlay, we don’t have to decide whether or not the school rankings are 100% accurate any more than we have to decide if green is better than blue.

Remember, if you can’t afford blue…green may be your best option and if you can’t afford green, pink in the best school may be your best option. OR pink with a great school might be better than green with a lesser school. OR…as pink gets darker toward another school district…a better school in the OTHER school district may be a better choice. These are the kind of things you need to consider when choosing an agent or choosing to represent yourself. Recognize these factors as “real” and learn from where the foreclosures exist and why those foreclosures happened.

That’s why you have to know why these areas are “colored” as such, and what they draw their value from. The upper pink section on the left is pulling from Bothell and Northshore School District vs Lake Washington (the lake itself) and Downtown Kirkland, as example. You might want to step over that line…or not.

If you take The School Boundary Map and overlay it on the VALUE GRID you will not be surprised to see the Dark Blue area serviced by a highest ranked school and the lowest ranked school planted firmly in Pink.

Life is not quite that simple and I’m not going to go there with you in this public forum. I give you the tools, you being a “reader” vs “my client”. There are limits to how much credibility I will lend to these ranking sites as a professional, and those limits are only shared with my clients. But hopefully, no matter where you are looking to buy, this shows why EVEN IF YOU DON’T CARE ABOUT SCHOOLS, you should not overlook the secondary value pressure of which elementary school is servicing the home you choose.

********

3) Market Value’s Relationship to Assessed Value in the “target market”

This is a little harder as you have to balance some other factors like land value, main floor footprint and home style. It looks something like the chart in the link just below this sentence, that I have used in posts before:

Market Value vs Tax Assessed Value

For a “target area” we will be blending steps 1 and 2 with this 3rd step, using the same color key as in the link above from green to red, which is different from Step #1 and it’s color codings. In this final step, lighter green is best (vs blue), but red is almost always a “stop sign” of some kind. 🙂

I’m going to lose a few more people here, but for those who are seriously needing to understand value of homes in order to pick one and make an offer…try to stay with me here. Be sure to click on that blue link just above marked “Market Value vs Tax Assessed Value” before moving on to the charts below.

COLOR AV CHART

The BLUE background chart relates to point #1 and is a “Blue Value Grid Area”. In a Blue Value Grid Area, your best hope may be a Blue Price as noted in the KEY to the right, that being 1.2ish times Assessed Value. A few may even sell at the RED “bubble prices” if they are near water, have water views AND have been fully remodeled. You might find a green or two, but they will likely be “tear downs” selling at lot value.

If you are making Green offers in the Blue Zone….you may never achieve success UNLESS when you draw YOUR target MV vs TA map, there are some green sales.

The PINK background chart at the bottom also relates to point #1, but most of the sales ARE green and none are red. In this area you DO NOT want to buy in the purple or above zone without VERY good reason.

I’ll try to simplify this. Let’s say most houses assessed at $800,000 sell for $950,000 in the Blue Zone. NONE have sold for less than assessed value except for the tear downs, or busy road, or malfunction of floorplan issues. That means if you keep looking for a GREAT house with no negatives and making offers of less than Assessed Value, then you are going to get frustrated.

BUT if you are in the Pink Zone where homes sell fairly regularly at assessed value or less (you need to do the actual stats to know if that is the case, this is just an example of HOW to do that) then you don’t want to be paying 1.2 or more times assessed value or $470,000 for a home assessed at $390,000.

EACH AREA will have it’s own relationship to Tax Assessed Value. This has ALWAYS been true in the Seattle Area and is a much better valuation tool than Price Per Square Foot, especially in areas with basements.

You need to calculate if your area of interest is a .97 of assessed value area, a 1.13 times assessed value area or a 1.25 times assessed value area. NO “area” will be a 1.5 times assessed value area right now…but a given house may be.

I’m going to stop here as I’m sure I’ve lost quite a few people by now. But THIS is roughly how good agents “work”. They don’t necessarily make little maps that look like alien solar systems as I have here. But this is an attempt to convey to you the process of how an agent generally values homes and the property they sit on.

Feel free to expound on the topic by asking specific questions in the comments. I’ll do the best I can to explain further in direct answer to those questions.

This Week in Seattle Real Estate

Short Sales and Bank-Owned property as a percentage of the total market is a very important topic. One worthy of tracking on a week to week basis. There seems to be a false sense that these are “evenly distributed” throughout the County. Rather than get into a “yes they are; no they’re not” spitting match, let’s look at the actual data.

King County as a whole:
7-12 kc

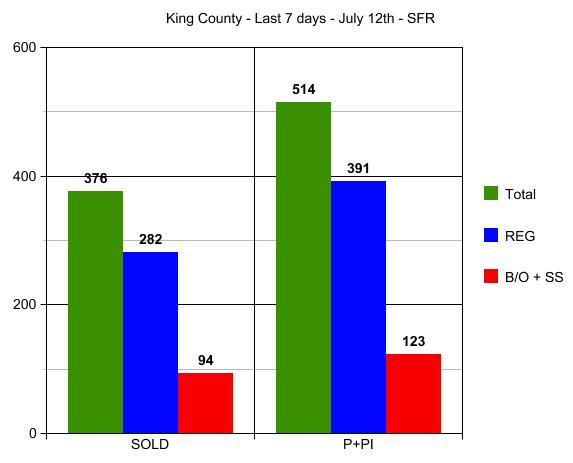
In the graph above we see that 25% of all property sold in King County this week were “distressed” sales. For those who like the break down, 49 of those 94 were Bank-Owned properties and 45 were Short Sales. Not a significant imbalance one to the other. Not a significant difference in % of total sales on those that went Pending this week. I’m counting Pending Inspection and Pending since that will not duplicate the stats and will capture those that went straight to Pending with no inspection requested. That total is almost 24%…so not a big difference between closed sale data and pending sale data.

BUT when you look at some of the break-downs by area…HUGE DIFFERENCES!

7-12 sold

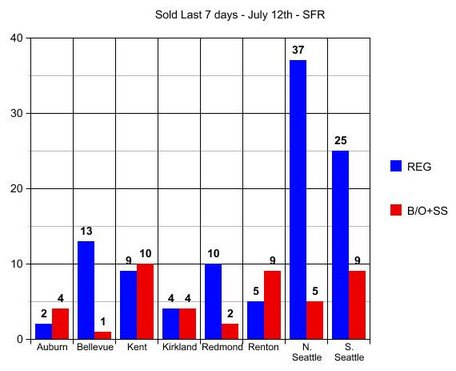
4 out of 6 of the closings in Auburn were distressed property, but only 1 of the 14 in Bellevue was distressed. 9 of the 14 sold in Renton were distressed property, but only 2 of the 12 in Redmond were distressed. Kirkland’s results are over-stated here and usually look more like Bellevue and Redmond’s numbers. You can see that in The Pending Sale Chart which for some reason would not post here, so I put it over on my blog.

I will try to run the stats every Monday so that we can combine them in 4 week comparison blocks. The results will vary somewhat from week to week, BUT some areas are clearly 50% or more distressed property, while others are only 10% to 15% distressed property. Looking at valuation factors for all of King County as a whole will not tell you enough. You could clearly be overpaying for a home in some areas, if you are using a County Wide % as to how much the market is up or down. There is a HUGE variance, as you can see in the graph here and the one over on my blog.

Again, apologies for not putting that 3rd and final graph down here and diverting you elsewhere to see it. When Dustin gets back from having fun, maybe he can figure out why it wouldn’t take.

(required disclosure – the stats in this post and graph were not compiled verified or posted by The Northwest Multiple Listing Service)

The Morality of Walking Away

This is not legal advice. For legal advice, consult an attorney not a blog.

I came across this interesting article in the Wall Street Journal, that bastion of conservatism. The article goes into some detail encouraging homeowners to just “walk away” from houses that are deeply under water (not literally, of course; rather, the owner owes much more on the property than what the property is worth). For the record, I agree 100% with the sentiment expressed by the author. Any successful business — or business person, for that matter — would not think twice about breaching a contractual obligation if fulfilling that obligation made no business sense whatsoever. In this regard, and as noted by the author, the economy is fundamentally amoral. It is high time that “regular” people take the same approach as the wealthy and Big Business.

That said, is it really a good idea? I’ve discussed the issue previously (in two parts). Here, I’ll only say that Washington is generally a non-recourse state, but that the situation is much more complicated if you have a second mortgage. Whether you decide to walk away or not, though, that decision needs to be based on what is in your (and your family’s) best financial interests. “Morality” should not factor into the equation.

How Does a Short Sale or Foreclosure Impact Your Credit

Ardell posed a question on her last post about credit scoring that I’ve been meaning to address here at Rain City Guide on how credit scores are impacted by short sales or foreclosure.    When I was speaking at the Mortgage Girlfriends Mastermind Retreat in Scottsdale this summer, I had the opportunity to meet Linda Ferrari, a well known credit expert and author of “The Big Score – Getting It and Keeping It” (a book I highly recommend everyone read).   

According to Linda, “a foreclosure can drop a credit score 50-250 points (this includes points all ready lost to delinquent payments).   The difference in point loss depends on how many points someone has to lose in the payment history factor of his or her credit report.   Thus is someone has a 750 credit score and they opt to foreclose, their score could drop 250 points.  However if someone has a 500 credit score, they may only lose 50 points for the same derogatory.”

It hardly seems fair to me that someone who has established excellent credit and they are faced with a huge financial hardship, they’re penalized on a greater scale simply because they have “more to lose” (reminds me of our income tax system)!   With a foreclosure, you can expect to wait about 5-7 years to purchase your next home (based on current guidelines) assuming a mid-credit score of 680 and a 10% down payment for conventional financing.  

A deed in lieu of foreclosure may impact credit scores the same as a foreclosure depending on how it is reported to the credit bureaus–they don’t have to report it as a foreclosure…if they do, the credit will be scored as such.    Here’s what Linda recommends you try negotiating how the deed in lieu is reported on your credit with the lender in preferred order:

  • Paid As Agreed.  Credit scores will have already dropped over 100 points due to default in payments; however, if reported as Paid As Agreed, the borrower will be able to purchase another home in a shorter time period.
  • Paid Settlement.  Credit scores could drop 75-100 points in addition to the points already lost for delinquent payments.
  • Foreclosure.  Credit scores could drop 100-150 points in addition to the points already lost for delinquent payments.
  • One advantage of a deed in lieu of foreclsoure is you may be able to purchase a home, if you so desire, a minimum four years afterwards with 10% down payment, based on current guidelines.  

    A short sale is potentially the least damaging to your credit scores assuming you’ve been able to make mortgage payments on time.   According to Linda, credit scores may drop from 50-150 points (depending on what else is going on with your mortgage and credit history).    You may also be able to buy a home quicker using this route.   Linda Ferrari writes on her blog why you may not want to consider using a short sale as an option should you be in financial distress.  

    FHA may allow borrowers who have lost a home due to short sale, deed in lieu or foreclosure a little quicker than conventional financing–around three years depending on various factors.   Extreme extenuating circumstances may allow for a shorter time period.   Again, this is current guidelines.  I wouldn’t be one bit surprised to see FHA change this guideline to be more in line with conventional financing.

    You have to keep in mind that credit scoring is accumulative, everything is factored to come up with those three scores that are suppose to reflect your current credit.   The only real good news about credit scoring is that your scores are temporary–they are changing constantly.  Pay down a credit card, establish good payment history on your installment loan and your scores will improve over time.

    Fannie Mae Announces Deed for Lease Program

    In a press release this morning, Fannie Mae announced a new program for homeowners who are facing foreclosure and who do not qualify for a loan modification:  Deed for Lease.  Distressed homeowners would complete a deed in lieu of foreclosure back to the lender anad then rent their home from the lender at market rate.   Leases may be up to 12 months followed with a month to month option.  

    Jay Ryan, Vice President of Fannie Mae says:

    “This new program helps eliminate some of the uncertainty of foreclosure, keeps families and tenants in their homes during a transitional period, and helps to stabilize neighborhoods and communities.” 

      For homeowners to qualify for the Deed for Lease Program:

    • The home must be occupied as a primary residence.  Investment properties may be eligibile as long as there is a tenant occupying the propert and willing to participate in the Deed for Lease Program.  
    • This program is not available for second homes or vacation homes.
    • Available for 1-4 unit properties where Fannie Mae owns the mortgage (not available for government guaranteed or insured loans: FHA, HUD, VA, USDA).
    • Second mortgages/liens on the property are not allowed;
    • Borrower/tenant must be able to document that the new lease payment does not exceed 31% of their gross monthly income.
    • At least three mortgage payments must have been made since the last origination/loan modification.
    • Borrower may not be more than 12 months past due on the mortgage.
    • Borrower/tenant may not be actively involved in a bankruptcy.
    • Rental insurance may be required if there are pets.  (You probably want rental insurance regardless).
    • Borrower/tenant will need to pay a lease application fee of $75 fee per unit.

    I’m wondering if this will be considered a taxable sale — will there be excise tax due?   A title insurance policy will be required to prove the title is “marketable”.    The properties will be inspected to make sure the occupants have kept the home in good condition and to permit the marketing of the property for sale.  I would hope that the Deed for Lease tennant would have the first right to re-purchase their home during the 12 month period.   According to Fannie Mae’s announcement: 

    “A Deed for Lease property that is subsequently sold includes an assignment of the lease to the buyer.”  

    Homeowners will need to work directly with their mortgage servicer (who they make their mortgage payment to) in order to see if they qualify.  According to Fannie Mae, mortgage servicers can offer this program immediately–however, you can bet it may take a while for this program to become available.   Fannie Mae offers these instructions for homeowners who are considering this program.

    I’m wondering if there is excise tax due on the sale of the property to the lender.

    The intent of the program, which I applaud, is: 

    “to minimize family displacement, deterioration of neighborhoods caused by vandalism and theft to vacant homes, and the effect these have on families, communities and home price stabilization”.  

    I’m sure we all have abanoned homes in our neighborhoods and know families who have lost their homes.   Hopefully this will help make things a little better for all while our housing industry and our economy is trying to recover.

    Distressed property rental income: Who’s money is it when a home goes into default?

    This is both a legal question and an ethical issue.

    I’ve bumped into this, not in the workplace, but out looking at property :   A home that is in process of either a short sale or heading to foreclosure has tenants.  It is not that a homeowner does not have a right to rent a home or even part of their home, but when a homeowner is involved in a short sale, is in arrears (default), most lenders require substantial paperwork from the owner justifying their hardship. My guess is that the rental income could be kept under the radar.   Many homes in default are the result of job loss or other hardship due to medical reasons or other life issues.   In some cases though, defaults are a result of excessive equity withdrawal from serial refinancing.

    Homeowners in a short sale are typically not allowed any proceeds from the sale as a condition of approval.  But, if the homeowner is receiving rental income from the property, should that money be forfeited to the lender to help cure the debt?

    I have not been able to find the languange in a standard Washington State Deed of Trust form, but I thought I read somewhere that rents are collectible by the lender to help cure the debt when a default has occurred.   I could be very mistaken.

    Loan Mod Firms: Attorney “Backed” or Attorney Representation

    A story today in the NY Times contains interviews with salespeople who worked for an attorney-backed loan modification firm in California that is now under state investigation for defrauding desperate homeowners. 

    “Despite making promises of relief to homeowners desperate to keep their homes, FedMod and other profit making loan modification firms often fail to deliver, according to a New York Times investigation based on interviews with scores of former employees and customers, more than 650 complaints filed with the Better Business Bureau, and documents filed by the Federal Trade Commission in a lawsuit against the company. The suit, filed in California federal court, asserts that FedMod frequently exaggerated its rates of success, advised clients to stop making their mortgage payments, did little or nothing to modify loans and failed to promptly refund fees…For fees reaching $3,495, with most of the money collected upfront, they promised to negotiate with lenders to lower payments on the now-delinquent mortgages they and their counterparts had sprinkled liberally across Southern California.  “We just changed the script and changed the product we were selling,