 A seller setting a time in the future when they will review all offers at the same time has become common enough to warrant a blog post explaining the general pros and cons and procedure for this type of listing instruction. I just did a spot check of new listings in Kirkland 98033 and a full 2/3rds have this instruction, including both single family homes and condos. If you look only at the single family homes, the percentage is even higher. There is very little written on this topic that can be googled, so I will try to explain the ins and outs of this process best I can. Everyone does it a little differently, so this is by no means a full explanation or an absolute description that pertains to all listings with this instruction. But it should serve well as a guide to those who have not run into this yet, such as first time buyers just starting to look at homes to purchase.
First it should be noted that the SELLER, and not the Agent, must direct this instruction. Usually as a result of a conversation with the seller regarding whether or not they “have to” respond to the first offer quickly. In fact while I noted 2/3rds of the listings have the direct wording “…will look at-review offers on…” At least half of those who didn’t show that restriction, throw in vague language insinuating that the seller will not be responding quickly because they are out of town for a few days. A roundabout way of saying “…will look at offers on…” loosely.
Let’s lay out the mechanics of how this works before discussing the pros and cons from both the Seller and Buyer side of things. To that end I will describe how I do it.
Usually I list a property on Wednesday night after midnight, which is actually Thursday morning. I do this because the public sites don’t always pull the photos in the same data pull as the listing information, causing the listing to appear in mobile instant alerts with no photos. By listing a property in the middle of the night, the photos have time to catch up with the listing by the time people wake up and view the new listing on their phones or laptops. So I do this whether there is a “…will look at offers on…” instruction or not. Most often the “…will look at offers…” day and time will be Monday in the evening with a deadline for receipt of offers in the afternoon. This gives the agent for the seller time to print out and review the offers, call agents if needed for explanations or changes, and often summarize the offers in advance of meeting with the seller to review them.
It really is as simple as that without going into the particulars of how, when and why to apply this instruction or not. So we’ll move quickly into what this means for Buyer and Sellers with some of the pros and cons.
BUYERS:
When you first see a listing come on market that you want to see, you usually contact your agent. These days the first thing the agent looks for is this instruction, because it almost never shows in the public remarks and only in the Agent Only remarks. I don’t have a good “why” for that except that the public remarks has a limit as to number of characters, and most if not all of that is used to advertise the property with no room left to go into other topics. The agent only remarks area is even more limited, but there is usually room to very briefly describe this agent instruction.
The main reason the Agent for the Buyer first looks for this instruction noting how FIRM…or not…the instruction is, is to determine how quickly the agent needs to meet the buyer at the property.
If you see a property come on market on Wednesday or Thursday and they are not looking at offers until Monday, you still want to see it as early as possible to have time to consider the property before writing an offer. But if this instruction appears, you might not have to jump up from work with no notice or leave the children standing in front of school waiting for you to pick them up or interfere with the baby’s normal nap time. ALSO not all agents can jump up “right now” to run over to the property the minute it hits the market.
So the primary benefit to buyers and their buyer’s agent is it gives them a bit of time to schedule a convenient and mutually agreeable showing time.
That does not mean you wait until a Sunday Open House if the property comes on Market on Thursday and they are looking at offers on Monday. In fact most of the time I do not do an Open House during that 4 to 5 day period which encourages the buyer and their agent to view the property privately, which is usually better for the buyer. The more time you have after seeing the property to investigate further, collect your thoughts, make a good and firm decision before writing an offer…the better. The time frame is short enough from list to review date. Use that time wisely.
The second and possibly only other benefit to the buyer is it gives them some time to fully consider both the property and their offer before needing to submit that offer.
Some people are very quick decision makers and others are not. From what I have seen, buyers who have competed in multiple offers without success respond much more quickly than those for whom this is their first offer. This is not a “how to win in multiple offers” post, and in fact my next post may be “how to LOSE in multiple offers”.
This is just a basic outline of a common practice that most all buyers need to be aware of if they are looking for homes in some of the most popular neighborhoods in the Seattle Area.
Cons to the buyer of course are that they have to wait until Monday for an answer from the Seller and they are more likely to have to deal with multiple offers than if they could write an offer within an hour of the home coming on market and put a response time of same day. However this “con” from the buyer side will be addressed more as a “pro” from the seller side.
SELLERS:
Whether it is a strong or a weak market, over the 25 years I have been helping sellers sell their homes and buyers buy them, most every seller likes the property to get past the weekend before responding to offers. Given the best buyers often work for a living, unless they are cash buyers, the seller would like the people who are working for a living to have a chance to see their home before the seller responds to offers. They like their home to be listed before the weekend and they like to look at offers after the weekend. This is nothing new. In fact I just saw a house that used a wishy-washy “…will look at offers on…” stated as “Seller would like to wait until after the Open House on Sunday to respond to any offers.” I’m not a big fan of wishy washy as it leads to confusion. Some buyers will read that as a hard and fast indicator that they have plenty of time, only to be very upset to find that the house was sold earlier and the Open House was cancelled.
It is very important for the Agent for the Seller to have a very LONG and detailed “What IF?” conversation with the seller, to pin this down very clearly as to the sellers’ wishes. If the seller is a couple, you need to have this conversation with BOTH sellers.
This is not to say that the Agent should guide the seller to a “…will look at offers…” instruction. But it is important for the agent to know the sellers intentions by asking questions such as:
“If you receive an offer on the first day the property is on market and the buyer wants a same day response, are you prepared to accommodate that offer as written?”
The answers to that question are many and varied and almost no one answers a clear YES. That surprises some buyers and even some agents that the seller wouldn’t be very happy to have a good offer on the first day and take it on the first day. But in my experience the answer is usually another question as in “Do I HAVE to?” Once the seller has indicated a reluctance to accept an offer, the Agent for the Seller needs to go through a whole series of what ifs to come to a full understanding of the Seller’s intentions as to how they plan to react to offers.
Historically the “reasonable” time frame for responding to offers has been 2 days, not counting the day the offer is submitted.
In the above noted scenario of listing by very early Thursday morning, the anticipated response date and time would be Saturday by 9 p.m. here in the Seattle Area where a day ends at 9 p.m., unless stated otherwise. HOWEVER the buyer is the one who types in the response date and time in the offer and what was previously reasonable and customary is not what all or even most buyers will do in a hot market.
Since control of that response date in the offer is on the buyer side…it is important for the seller to give an instruction if they do not intend to comply with whatever a buyer may write. It is not good for anyone to start off on the wrong foot by the seller being angry at the time given or the buyer being angry that the seller chose not to respond by the time given.
Most sellers whether they have an Open House or not would prefer the home be shown all weekend when most people are available to see it, than respond on Saturday night. So Sunday night would often be the earliest date the seller expects to respond and Monday night is not a stretch and gives those buyers who weren’t available until Sunday, or even very early Monday if they were out of town for the weekend, a chance to see the property.
You might ask why not longer, and the answer to that is buyers are often frustrated with waiting 4 days and so extending that to a week or 10 days is really pushing it and usually causes more harm than good. That is a conversation the Agent for the Seller and the Seller discuss in the “what ifs” discussion. Every Seller will have a different opinion and there are no hard and fast rules and every Agent for the Seller will have a different counsel on that subject. For the most part, since I can’t speak for every Agent in the Country, I am basing most of this on how I do it and on conversations I have had with actual sellers. But the options can be many and varied.
The obvious Elephant in the Room from the buyer side is “Aren’t you just trying to start a bidding war?” Or from the seller side “Do I HAVE TO take a full price offer?”
This is where the issue gets very controversial and it is not uncommon to get some very angry calls within the first hour the home is on market.
1) NO the purpose is NOT to instigate a bidding war. The purpose is to give the seller a reasonable time to market his/her property before having to accept an offer. By any definition and anyone’s perspective, 72 hours seems reasonable. So Thursday to list, Friday-Saturday and Sunday to view and prepare offers, and Monday to submit and respond, seems more than reasonable. Except to the person who wants to be “The Early Bird Who Catches the Worm”, and I don’t blame them. But that, in many if not most cases, does not give the Seller ample time to market his/her home.
For some sellers “ample time” could be much longer or possibly shorter. But the bottom line is the seller gets to decide what is and is not “ample time”.
2) Pretty much yes…you do “have to” as to the seller’s question of whether or not they have to accept a full price offer. At least this is the conversation BEFORE the home is listed for sale. Mainly because the Agent for the Seller needs to confirm that the seller is willing to take the price at which they list the home.
It’s OK to hope for multiple offers and a price higher than the list price. BUT it is NOT ok to list the home for less than you are willing to take.
To some extent the rules and practices of this particular topic have changed somewhat since Craig wrote a post with his concerns Titled “Offers to be Considered on a Future Date” Is this Really Fair to Buyers?” in that sellers have to attach the instruction before the home is listed and must note whether or not they intend to reserve the right to NOT wait until that date to respond. Still, reading his post via that link in conjunction with this one is advised.
I wish I had 10 or more links to others expounding on this topic, but the only other has been here on Rain City Guide that I can find. If you see any others on “…will look at offers on…” vs simply multiple offer situations which I will cover in my next post, please do put those links in the comments. Thank you.

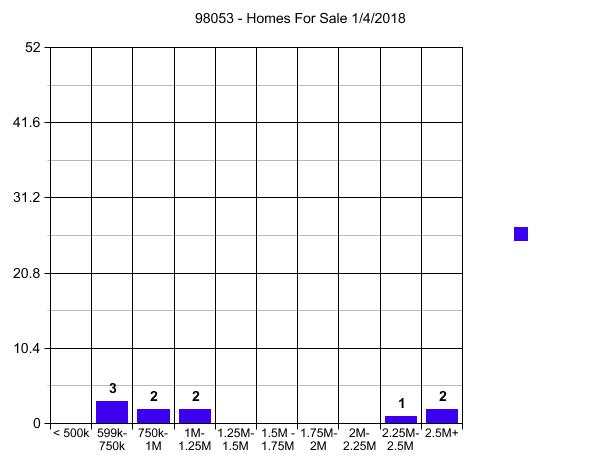
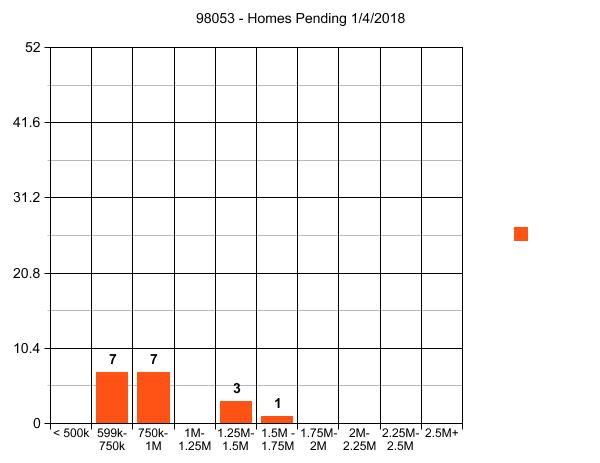
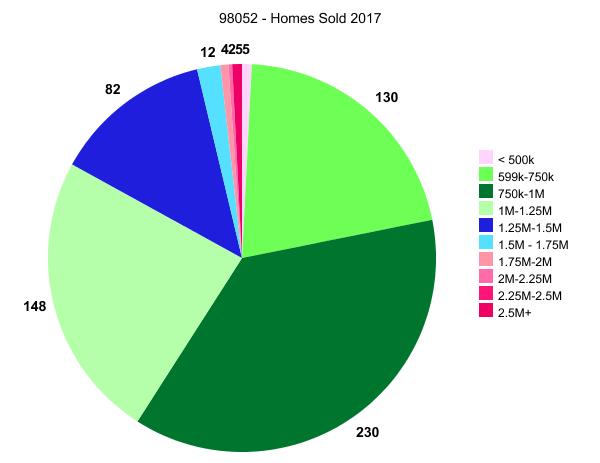

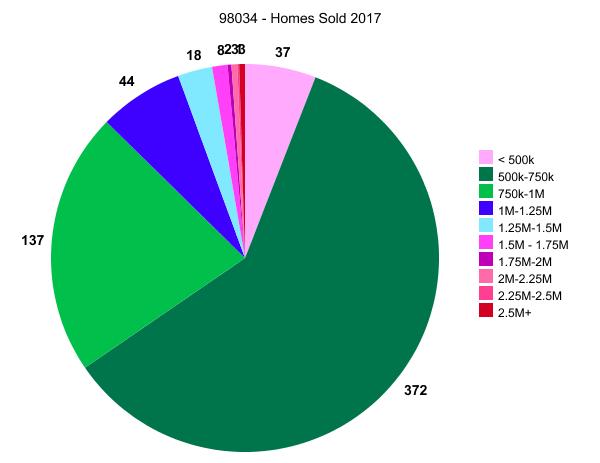
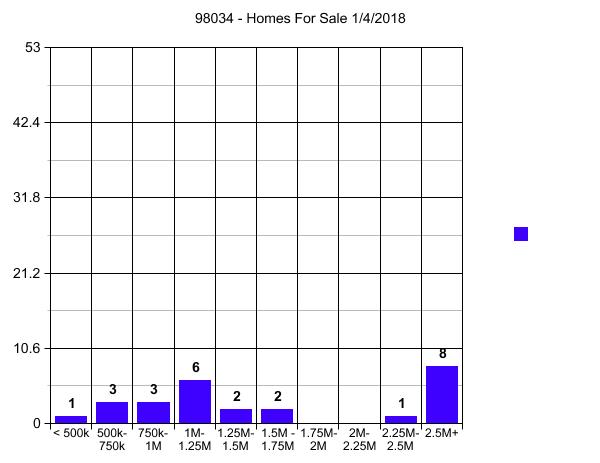
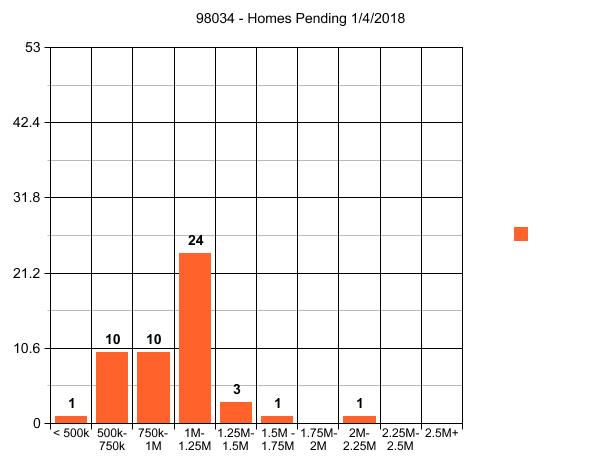
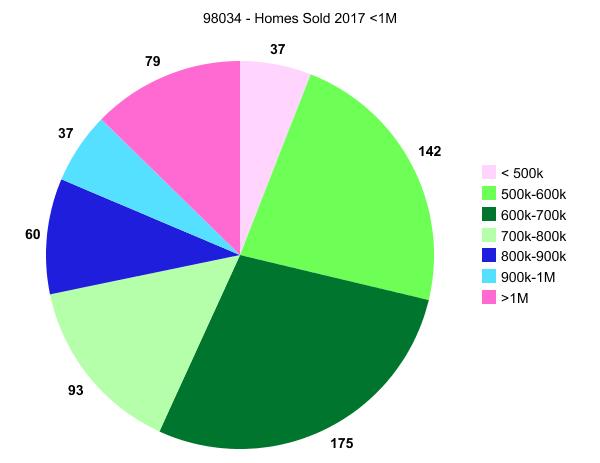
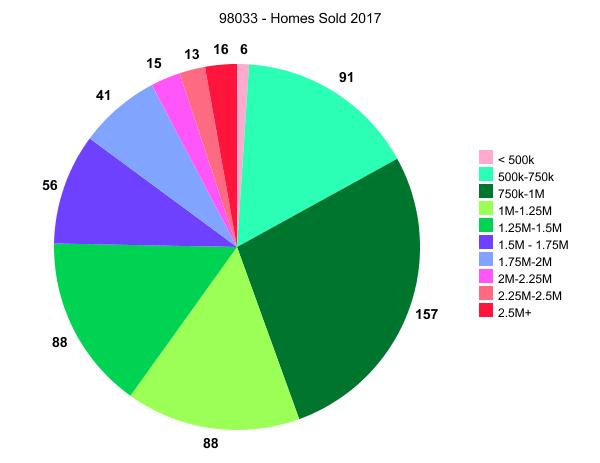
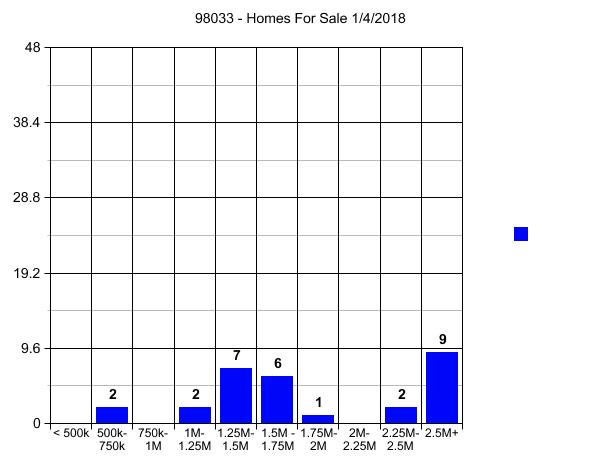
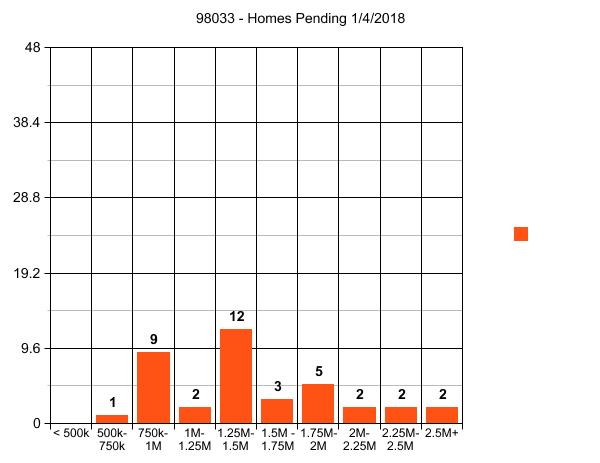
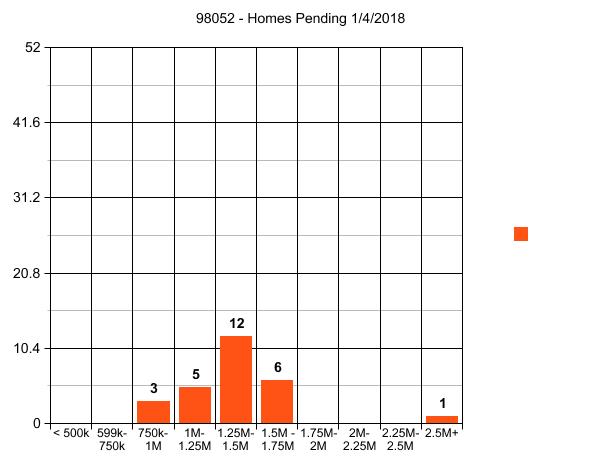 2018 Home Prices in Kirkland 98033