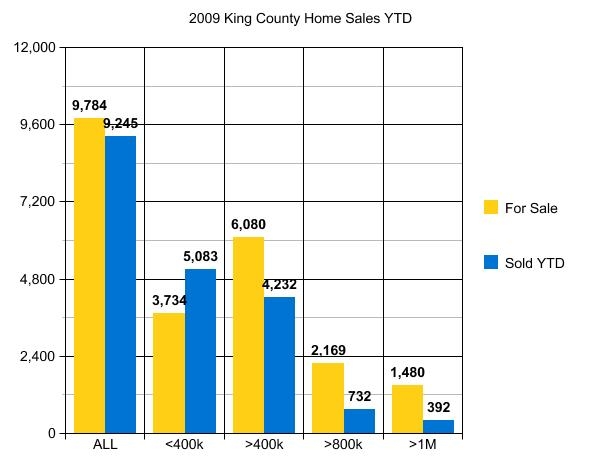
 While I am not seeing any huge surprises in the market overall in King County, there were some jaw-dropping results in individual neighborhoods.
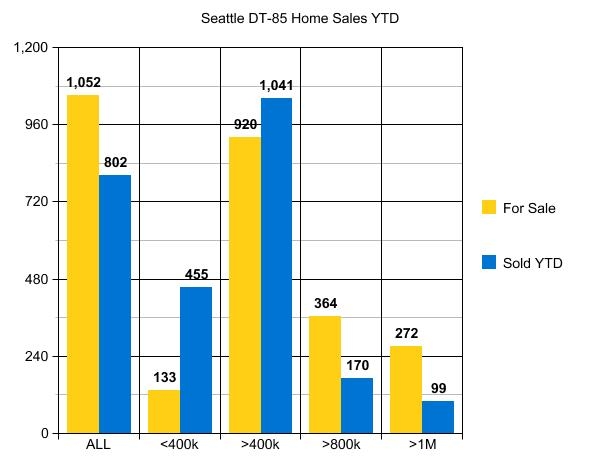
Amazingly great results from Downtown through 85th in both the first and second price tiers.
Amazingly poor results in Kirkland’s 98033 vs 98034 zip codes. Those areas are usually reversed in terms of performance.
Redmond did not perform as well as they did last year. Bellevue only doing well in the lowest price tier.
All of King County still struggling in the over $1M market, with no exceptions.
The clear winner by far shown in the 2nd graph here, as compared to other parts of Seattle and the Eastside. Those figures of only 133 for sale in the lowest price tier, with 455 sold YTD, is beyond anyone’s wildest dreams for this market. My guess as to the dismal results for 98033 is that most of the cheapest homes used to be sold for lot value…and there are few takers for building lots and tear downs these days. The remainder of the problem is likely that homes are just overpriced, and buyers are getting much better at finding true value, vs negoatiating off of list price. This is sending the 98033 buyers into 98034 for better values and larger and nicer homes for the money.
I will be doing some in depth studies of the neighborhoods from Downtown through 85th to see if Queen Anne is outperforming Capitol Hill or if Fremont is outperforming Green Lake. Overall…as a group…clearly the best neighborhoods in terms of consistent performance which could be the hedge one is looking for against further price declines.
(Required Disclosure – The data used in this post is not compiled, verified or posted by The Northwest Multiple Listing Service. Hand calculated by ARDELL.)


