Redfin's First Year

In a follow up to Dustin’s post, I started to examine Redfin’s numbers in a bit more detail.

Redfin released a report today (it was yesterday, but I am on vacation… I guess you can say Maui Time :)) that opens saying, “Finds .904% Negotiating Advantage, 1.952% Average Commission Refund, 95% Customer Satisfaction; The Most Common Type of Redfin Buyer is a First-Timer

What the Viaduct Vote means (even to those outside of Seattle)

[photopress:viaduct.jpg,thumb,alignright]I realize this blog reaches outsides of Seattle, so I will see if I can make this have meaning for everyone and for those of you that knew Dustin in his prior life, you will know this is right up his alley too :).

I am on vacation this week, but was catching up and reading Sunday’s Seattle Times article about the up and coming Seattle viaduct vs. a tunnel vote. For those of you who do not know about this vote (or like me and are a bit confused) here is a quick synopsis.  There are 4 options.

One: Yes on the viaduct.
Two: No on the viaduct
Three: Yes on the tunnel
Four: No on the tunnel

Seems pretty simple to me, but with the way the ballot was written these are actually two separate votes.  So in theory, both could win or both could loose.  They SAY the probability of this happening is very slim, but you never know, crazier things have happened i.e. 2004 Washington State Governor (if you have never read this, this is a great read!).

This may be a stretch, but in my eyes, this raises the question of how does any city solve a problem that affects a limited group.  The same was true for me with the Monorail where a finite group of people (primarily western Seattle) would have the convenience of using the monorail, but all of Seattle’s roughly 572,600 residents would have been on the hook for the bill.  While I have no political agenda in this post… I do believe in mass transit. This is a message asking if it is fair for an entire city to be called upon to pay for a major tax measure that limited number will enjoy.

I am not saying if a major section of a city needed repair, it is not up to all of the city’s population to pay.  The message I am attempting to convey is that the measure being voted upon can be solved in other ways.

[photopress:narrows.jpg,thumb,alignright]A great comparison would be the second Narrows Bridge connecting Tacoma and Gig Harbor.  This project is being financed through state tax exemptions, a bond and a toll. The basic difference here, is that users of the bridge (commuters and travelers alike) are paying, rather than all area citizens.

Again this is not about my support (or lack) of an issue, this is about what is fair.  If the viaduct is taken away and a tunnel is built, can we assume it will be similar to Boston’s Big Dig.  What about the young professionals who have puchased a downtown condo so they could avoid a nasty commute?  Should they pay for a tunnel or new viaduct that they won’t use?  Shutting down a major roadway to and from a large section of any city will have (in my mind) have a significant affect on traffic which will therefore have an affect on real estate values in that area (see I brought it all back to real estate).  In my own opinion, I am not interested in living in Queen Anne if I cannot use 99 (which is bordered by the major access highway that will be closed) .

So much for being unbiased.

Housing sales fall in 40 states; but not in Northwest

[photopress:sputtering_starts.gif,thumb,alignright]Interesting story of the differing views from US (not U.S.) and those outside of the Rain City. One of my development partners (Mike) is from Michigan and is one of those 40 states with falling sales (not to mention increasing unemployment).  As if the bubblers need any more endorsement to foster their cause the Seattle Times reported Housing sales fell in 40 states… but not the NW yesterday.  Before I read the story in the times Mike sent me the view from the vast majority of the country as seen on CNNMoney.com ‘Housing starts plunge‘.

The CNN reported that housing starts fall much more than forecast, to their lower level since ’97.  They go on to add what in turn I call the LARGE BUILDER EFFECT; permits also fall as single-family permits hit 6-year low.  The Large Builder Effect is a trend that occurs and will effect new housing starts about 12 months down the road when the permits are issued (permit times vary in each municipality).

So what does this mean?  The nation’s leading homebuilders have all reported declining sales and prices for new homes(hence the fall in permits).  Another partner of mine Snohomish County builder I know actually expressed the same views in November, but said since the first of the year his sales have bounced back to their expectations and he is continuing to submit for permits.

Do people behind the Rain City Curtin have their blinders on? Time will only tell, but if history is any guide (and I am NOT a historian) I would guess in time, with a smaller supply of products, demand will eventually grown so even though sales may be sluggish, over a 3 year window sales will continue to grow.

NOTE: I am leaving town after today, but I will do my best to reply to comments.

New-home sales plunged… blah blah blah… largest amount since 1990… blah blah blah

I am sure everyone in the industry (or who follows the industry) has heard the same thing.  I actualy meant to publish this blog in late January when the PI posted the article… but better late than never.  I know lots of my clients, investors and friends have been asking me this same question for a while now.  So what do I say to them? OR… What do I say to all of those real estate bubble watchers!

The reality is that two thirds of the households in the U.S. lived in their own home in 2000. In 2000 the median value of these homes was $119,600. This is 18% more than the median value in 1990, and more than double the median value in 1950 of $44,600 (in 2000 dollars).  With a quick look back at 2006 and you see the national average was $224,900.  That is an 88% return in those 6 years or a 15% annual average.

So houses dropping by more than 8% last year is not that bad in the slightly bigger picture.  It still is not an easy pill to swallow considering prices are down 17.3% from 2005.  Which seems crazy, but considering the stats in 2005 was averaging a 24% increase a year and an average price in 2005 of $264,932.

This is a conversation for a different day, but if you want to take in to account that most of these homes on average were purchased with a down payment of 20% or less.  Let’s assume your mortgage was equal to your payment (just to keep it simple).  That means on average in 2000 a home owner’s (roughly) $40,000 down payment would have returned that original down payment + another $64,932 in 2005 a 162% return!  Not as good, but still a steller return using 2006 numbers, still a 50% return.

That is what I say

The Perfect Real Estate 2.0 Company

[photopress:timeYOU_big.jpg,thumb,alignright]If I had millions of dollars like Jim and Shirley Wilson now have (254M Powerball this week) I would create what I feel is a void in market today. I would take a Zillow like property evaluation tool and add a social networking back end to it. This was actually some of the conversations Dustin, Robbie and I had over a year ago when I was first introduced to RCG.

Anyway, what the market needs now is a valuation tool like Zillow that is enhanced by taking in to account neighborhoods, the particular street the house is on, the property’s zoning, the neighbors to your left and right and many many more. Zillow has added features to allow home owners to update their statistics for a closer estimate, but there is nothing out there that allows the brainchild behind Web 2.0’s success… YOU! (also a reason I feel the Web 2.0 bubble is far from bursting).

This would allow owners, neighbors and most importantly realtors to add comments to their communities, neighboring houses and their own house. I can only imagine how valuable this content would be to future home owners. Matter of a face, this would add some type of accountability to neighbors and home owners to be ‘good neighbors’. I guess this would be like a Better Business Bureau for home owners. I am sure all of the tenured agents out there have heard horror stories of their clients having troubles with a new home where the Form 17 disclosures could not provide any protection. This would be especially valuable in multi family communities.

[photopress:my_currency.jpg,thumb,alignleft]San Francisco’s my-currency launched today looking to tap in to this resource. John Cook’s blog talks about it as My Currency takes on Zillow which I understand, but I feel the underlying message here is putting the power in the people’s hand. It is easy for a site to put together stats that combines total square footage by numbers of beds/bath times a special area by area multiplier (I assume this is similar to the formula most of these sites use), but the does that mean someone will actually pay that price? If this were true, I would sell my house today for 200k more than I think it is worth because Zillow says so 🙂

2006 Statistical Review and Highlights

Straight out of the horses mouth. I noticed these stats posted by the NWMLS today. I found a smilar post on their public site, nwrealestate.com. You can see the detailed story here

During 2006, members of NWMLS. . .

  • Reported more than 96,000 closed sales with a combined value of more than $35 billion
  • Experienced a 6.7% drop in number of units sold compared to 2005, but an increase of about 5% in the dollar volume of the closed transaction
  • Reported 1,951 sales of single family homes priced at $1 million or more (up from 1521 during 2005) and 859 sales of condominiums priced at $500,000 or more (up from 623 during 2005).
  • The MLS area covering Bellevue/West of 405 had the highest number of million dollar-plus sales with 219, followed by Central Seattle/Madison Park with 165. For high-end condos ($500,000-plus), west Bellevue had the largest number (183), followed by Belltown/downtown Seattle (130) and Kirkland (117); 145 condos sold for more than $1 million
  • Among the 19 counties in the MLS service area, San Juan claimed the highest median price ($539,500) for single family homes that sold last year; King County followed at $425,000
  • Maintained a high ratio of cross-sales: more than three of every four transactions were listed by one office and sold by a different office
  • Added 139,814 new listings of SFH and condos to inventory, with the highest volume (14,541 added during June
  • Represented more than 30,000 home sellers, on average, each month
  • Reported double-digit price gains for SFH compared to 2005 in all but one county
  • In the four-county Puget Sound region (King, Snohomish, Pierce and Kitsap), only about 6% of single family homes sold for under $200,000
  • Sold more than 15,000 condominiums, about the same as during 2005; approximately 63% of all condos that sold system-wide were in King County.
  • Found wide variation in prices of 3-bedroom homes. For pre-owned homes (built 2004 or earlier), the median sales price ranged from $124,900 in Grant Co. to $508,000 in San Juan Co.
  • In King County, the average price of a single family home that sold in 2006 was about 2.9 times higher than the price in 1990 (up from $178,187 to $518,108).

NWMLS at a Glance

December 2006
Member Brokerages
2,075
Sales Associates
26,183
Counties included in Summary Report
17

Let me get this straight, you will pay me if it rains???

If you live in Seattle you will understand what I am talking about here. We had a client flying in to relocate to Seattle and with the weather we have been having, they have already had to cancel a home buying trip already. So watching the forecast the past week we decided this would be a good weekend to come buy a home in our beautiful city.

They flew in Friday night and we double checked with our local weather hero Walter Kelly (Q13) to make sure it would be ok for Saturday. About noon on Saturday we came to find out the 1000s of web sites out there that were predicting for mostly sunny skies all weekend were WRONG. Not only did we not have mostly sunny skies (like we did on Sunday) we had snow. That combined with the cold snap, our roads were not incredibly safe for driving all over the city. We did make it around and were able to make a joke out of it and were laughing about the fact that the weather ‘pros’ may very well be for pure entertainment. No matter what anyone says, it seems like there is never a 100% guarantee (actually, not even 75%).

Not only was it difficult for us to get around, but some the houses we were showing had tenants who had to leave while we showed. I started to think about my obligation to the client if we would have been snowed in and could not drive around. Of course I could not be held liable for what WE all felt was a good weekend, but you want to keep your customers as happy as you can.

[photopress:weatherbilllogo_sml.jpg,full,alignright]Then came as an answer to any agents prayers (or person with a wedding, outdoor BBQ, garage sale, etc), Weatherbill; a Web 2.0 launched today. They essentially are creating a market for that which cannot be controlled… weather. Their site puts it best and says, “WeatherBill sells Weather Contracts to eligible buyers. Weather Contracts can be used to protect your business from adverse weather conditions, by paying you when those adverse conditions occur.

You are breaking my heart Redfin…

I will start with a caveat. I am a owner in a real estate development company and I am not primarily shopping homes for clients, but instead buying properties to develop and build. That being said, you may think I have nothing but critiques for any other real estate company… not true! Dustin and I have been playing with mapping applications in regards to real estate for a long time. This is actually the way I was introduced to RCG.

Way back then we (LTD, not Dustin) were attempting to integrate what was not being done… Aerial parcel mapping of real estate listings. Around that time Redfin launched a pretty slick product. As a visitor of Redfin my only complaint was the size of the viewable space. There was no site out there that utilized the whole page like Microsoft’s Virtual Earth. The size and detail of the photos (at least in the PNW) were great and although not that recent at the time, much better than using what else was out there.

My biggest gripe with Redfin has been their use of space, most notably the size of their map. In my eyes you could get an idea of the neighborhood, but not a great idea without knowing the area already. Virtual Earth’s full size maps on the other hand were and are great. NWMLS made us change the name of the map because of the words MLS in the URL. MLSMAPSONLINE (image to the right) used the full size maps and parcel data much like Redfin, except we choose to use an opaque layer over a part of the map to maximize the user experience. We stopped working on that product when Zillow launched and we realized it would take too much $$$$$ to stay in the game.

Anyway as I said I am a guilty of using Redfin. When John L Scott did a great job when they launched their new site using Virtual Earth. A great job, but were still missing many of the features that made Redfin great. Redfin was much faster than the NWMLS for a simple search and easy to drag the map to increase the prospective area. I still never understood why they used such a small area for the map, but then again, they were my competition so I wasn’t that worried about the problem.

Then I heard they launched a new version using Virtual Earth. I was so excited when I caught word I quickly ran to my mouse and was ready for the thrill, but I was quickly let down when I saw they kept the same map size and page orientation.

Here is the image from Redfin

Here is the image from Shackprices

It would be great if when using Redfin you could see how the house sat on the lot, what size is the front yard, where the driveway is, in this pick the massive amount of trees in the front and rear yards, etc. I am sure the parcel box will be changed right away, but I am surprised about the map size and location of the content. There is plenty of room on the monitor, so I am confused. MLSMapsOnline used the vertical orientation, so I know it can be done.

In then end, this blog is not about a critique, but instead a nudge nudge.

Hotpads: A Slick Search Tool for Apartments, Rentals, Sublets and Roommates

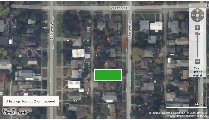
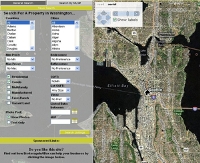
[photopress:hotpads.jpg,full,alignright]Thanks to John Cook post on Real estate timeline debuts, I found the greatest site for Apartments, Rentals, Sublets and Roommates I have seen. HotPads.com provides users with the ability to find dwellings based on Density, Per Capita and Median Age/Renters/Rent. They even use census data to color code their maps based on this data. For the property owner they create listings on HotPads is free and easy! If you are a landlord, they eve send your listings to Oodle and Google Base.

HotPads currently uses census data to color code our map based on a few different statistics:

  • Population Density
  • Per Capita Income
  • Median Household Income
  • Median Age
  • Percent Renters
  • Median Rent

Here are some examples from Seattle: Seattle, WA

Per Capita Income
[photopress:wa_seattle_perCapitaIncome.jpg,thumb,centered]

Household Income
[photopress:wa_seattle_householdIncome.jpg,thumb,centered]

Median Age
[photopress:wa_seattle_age.jpg,thumb,centered]

Percent Renters
[photopress:wa_seattle_percentRenters.jpg,thumb,centered]

Median Rent
[photopress:wa_seattle_rent.jpg,thumb,centered]

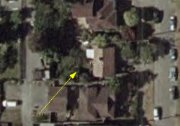
Even though rail stations are not available in the Rain City yet, with HotPads maps you can see various points of interest that might help you decide where to live:

  • Subway and Train Stations
  • Public Schools
  • Private Schools
  • Universities

[photopress:hotpads2.jpg,full,centered]

Points are added to the map with their nifty icons:

Colleges
[photopress:university.png,full,centered]

Schools
[photopress:schoolhouse.png,full,centered]

Train and Subway Stations
[photopress:trainStation.png,full,centered]

They are currently listing the following rail systems:

  • New York City Subway
  • Washington, DC Metro
  • Bay Area Rapid Transit
  • Bay Area’s Caltrain
  • Boston’s MBTA
  • Chicago’s El
  • Los Angeles County Metrorail
  • Denver’s Light Rail
  • Dallas’s DART
  • Miami-Dade County Metro

As John Cook pointed out (looks like Galen has added Shackprices‘ GREAT search to the list), their Real estate timeline is pretty cool too:

[photopress:hotpadstime.jpg,full,centered]

Social Networking at its finest

I wanted to try something a bit different. As we are all inundated with the new hot topic ‘Social Networking’ I thought I would show those of you who haven’t yet seen Fanpop, a great new network of “social portals”.

Fanpop calls these ‘spots’ and they are all created by their users. I love this idea because you get fanatic fans to rate their favorite videos, articles, sites, blogs, topics, etc.

Naturally, the current problem with the social sites is content. CONTENT IS KING and content takes time. In time, I assume if fanpop catches on, you will be able to search on ‘Seattle Mortgage’ and find happy customers who have recommended their favorite mortgage broker.

Take a look, it is pretty cool