“New on Market”? Maybe not.

The new listing numbers started out in 2010 with 3 digits vs 8 digits of the last decade and beyond. It would be awesome if we could track how many new homes are coming on market by these numbers. Unfortunately I am seeing many “new” listings on market for hundreds of days.

There is a rule against, and fine for, “trading up” your mls # from a 2009 or even 2008 listing number to a fresh 2010 one. But I am seeing many that “expired” vs. cancelled on 12/31/09 and then re-listed (often with the same agent) since 1/1/2010.

These listings are also coming up with the “n” symbol as being “new” on market. They are also showing as “on Redfin 1 day” so be sure to look at CUMULATIVE DAYS ON MARKET before determining whether or not it is really a “new” listing. You can do this on Redfin by clicking the property detail. Cumulative Days on Market seems to be “one click away” as in “on Redfin 1 day” but Cumulative days on market 455 days.

Maybe some day there will be only one mls # allowed per home address…on a 12 month rolling basis. But for now, there really are not over 3,000 “new” listings since 1/1/10, even though over 3,500 have been “newly listed” since 1/1/2010 as of today.

It’s possible that the mls will take away their “new” number, and give them back their old one. It would be great if they did, so we can track how many really new listings there are coming on market this year. So far I have not seen a way to search by “cumulative days on market”. I’ll have to ask Matt Goyer over at Redfin if they have an internal system that will do that. But if they did, I would think they would not be showing those “on Redfin 1 day” houses that have been on market for over a year.

Recommendations for a “good” Home Inspector

inspectorTrulia Voices is an excellent place to ask questions and also a good place for buyers and sellers to read other people’s questions and answers. Zillow has a similar feature, but I am not as familiar with theirs.

Today a Home Buyer in Seattle asked:

Does anyone have recommendation on a good home inspector – competent, reasonable service fee in seattle area?

The answers will likely continue to come in for days, and they are already an excellent resource for anyone looking for inspectors that are highly recommended by those who use them most often. Save the link, as these answers tend to come in for days and weeks forward from the day the question is asked.

Feel free to add your choice of inspector, either on the Trulia Voices linked questions, or the comments here on the blog.

Seattle’s Queen Anne Neighborhood Is Amazing

Queen Anne has long been one of my favorite Seattle neighborhoods because of its easy proximity to Downtown Seattle while still maintaining a “small town” feel.

Queen Anne Seattle WAThe Queen Anne Neighborhood of Seattle is amazing from all angles – on the North slope there are lovely views of Ballard & Fremont over the canal and the Fremont Sunday Market is practically right there!  To the East is Lake Union with houseboats all along Westlake, the Bigelow Ave portion of Queen Anne Boulevard, Downtown Seattle views, and more.  In the Southeast, the newer QFC is just one of the factors that make this part of the neighborhood score high on WalkScore (my latest Queen Anne contract  in this area has a WalkScore of 94!!!).  In the shadow of the iconic Space Needle, Lower Queen Anne or Uptown is full of restaurants, pubs, and nightlife and has the Seattle Center at its heart.  West Queen Anne is perched high above Puget Sound and offers sweeping views of the sound, city, Space Needle, Mount Rainier, and pretty much anything else you want to see as it is one of Seattle’s highest hills.  Upper Queen Anne is the true heart of the neighborhood and a stroll or drive along Queen Anne Ave North will show you why.  This is the heart of the upper portion of Queen Anne and where you can find all of the offerings from local clubs, restaurants, and merchants. One of my personal favorites is Queen Anne Books.

Historical Queen Anne: Queen Anne

Queen Anne is one of the original Seattle neighborhoods settled and the history of it is quite fascinating!   A stroll around Queen Anne Boulevard is a great place to start.  Old Queen Anne Boulevard is a series of streets that form a loop around the top of Queen Anne – a crown around the top of the hill.  Many people don’t know about the Boulevard, but it has been around in one form or another for about a hundred years thanks to the citizens of Queen Anne at the time who pushed for it.   Queen Anne Boulevard is Queen Anne’s version of the Green Lake path although it is almost a mile longer at roughly 3.7 miles and shares its surfaces with cars.   Look for historical sites on the Boulevard including the Wilcox Wall on the West slope, but also notice that there are some of the city’s best views along the way!

Queen Anne Real Estate:

Homes in Seattle’s Queen Anne neighborhood range from small co-ops and condos for under $200,000 to sweeping historical mansions priced in the millions, but the current median for listed residential (non co-op or condo) Queen Anne homes is $650,000 with a range of $325,000 to $4,890,000.  Although much of Queen Anne hill is made up of historical architecture, there are some really well thought out new construction projects on the hill – many that incorporate greener building products and that have incorporated the character of the surrounding neighborhood as well as the views available into their design.  Queen Anne has a lot to offer and can be surprisingly more affordable than one might initially have thought  in some areas.

Queen Anne Living:

This neighborhood is so livable!  The streets of Queen Anne are connected by a matrix of pedestrian staircases  (check out Thomas Horton’s map of them here) and sidewalks which lead to the wide array of  neighborhood parks, local grocers and shops, eateries, coffee houses, and more.  Transit is thoroughly incorporated into the infrastructure here with bus routes all over the hill.  If you are looking for a good no car option, than Queen Anne is definitely one of my top recommendations in Seattle, but obviously, with or without a car, it is one of my favorite Seattle neighborhoods!

Twitter on a Real Estate Blog?

Over the slow Christmas weekend, we added a new feature to RCG and it generated so many interesting conversations on Twitter, that I thought I’d bring the conversation to a blog post.

The new feature is the Twitter widget on the sidebar. Here’s a snapshot:

Picture 5

The current implementation shows all the tweets from this Twitter list: @tyr/rain-city-guide, which takes all “original” tweets from current contributors plus “replies” to others on the list.

The type of feedback I *though* I would get from the other contributors was: “awesome! More Seattle people reading my tweets!” but instead, the reactions were somewhat more tame… with initial reactions being along the lines of Ardell’s reaction: “I have lots of fun on twitter and say things inappropriate for RCG.”

However, the contributors were kind to me and seem more than willing to play this out a bit, but now it’s time for feedback from the rest of the community… Here are some of the options I see for including Twitter on RCG going forward:

1. “Do Nothing” option. i.e. keep “as is”

2. Show all replies from contributors. If I add each author individually to the backend of the plugin (instead of use a Twitter list), it should include all their replies so the feed would include more people and not look like “RCG contributors talking to each other.” (However, if you check out my twitter feed, you’ll see that I talk with people from all over the country, so it will add a lot more noise to the list. Ditto for Ardell)

3. Remove the Twitter feed from RCG. (Kevin Tomlinson voted for this option when he said: “@ARDELLd mixing mediums ain’t the way to go. imo

4. Include larger Seattle community. I could use a much more general list (i.e. more than just RCG contributors).  I’ve created a bunch of “Seattle” lists associated with the Rain City Guide Twitter account. We could modify one of these lists and include the updates from anyone on one of these lists, the benefit being the feed wouldn’t just show RCG contributors talking to each other, but the negative being there’s likely to be a lot more “noise” in the updates as more people are contributing to the feed.   As someone in the RCG community (yes, that’s you if you’re reading this!), would you be interested in being on the list???

Do you have a better option?

I’d love to hear your thoughts on the best way to bring Twitter into a real estate blog!

A Rebuttal to the RESPA Reform Poem

Over at Mortgage Porter, I posted a poem that one of my coworkers penned for humor about the new Good Faith Estimate.   One of my readers, who wishes to remain anonymous, has submitted a rebuttal which I think is very worthy of sharing here.  

Twas the week before Christmas
When a poem made its rounds
About a change in RESPA
That was about to hit the town

HUD said it was good
It would limit the greed
Protect all consumers
And a nation in need

A nation that was harmed
By the very same practice
They seek to preserve
Though we all pay though our taxes

Nation, wake up! We must awake from our slumber!
The path we were on will take us all under
If we do not learn, and learn today
It can all be gone
Like it almost was Columbus Day

Do you not remember? Can you not see?
What securitization, corruption has done to thee?
The stock market tanked
Foreclosures still run rampant
And they said, even so, you cannot make this happen

Assemble the lobbyists, consumer groups and more
Awake your Congressman, Senator
Or contributions no more
“Kill this thing, kill this thing,

Does #Fail = “Shadow Inventory”?

While my clients buy and sell in both Seattle and The Eastside, I often use The Eastside when diving deep into the stats, because the age and style of homes is easier to compartmentalize. My recent posts showing #FAIL in Bellevue, Redmond and Kirkland have raised the question “Does #FAIL = Shadow Inventory?”.

@darinpersinger on Twitter says: “I would be interested in knowing how many of those #fails were REPEAT #fails”

WaileaKid comments on the post here on RCG said: “All those red lines in the graphs above are the hopeful sellers that tried to sell in a market that they knew was falling. With the green shoots of recovery just beginning to show, these sellers will be out with a gusto. This is exactly the shadow inventory a lot of people are talking about. Looks like it will kep the prices suppressed for quite some time.”

Seattle Bubble Forum commenter, Barista, says: “Just look at all the failed attempts over this year. This looks like a huge shadow inventory to me.

Since my recent posts raised the question, seems only fair that I should answer it. For those who haven’t been following along since I started posting #FAIL stats on Christmas Eve, #FAIL = the total 2009 Expired, Cancelled and Sale Fail Release stats.

For the purpose of answering the question, I am going to use Redmond 98052 stats. These stats will not match the “Redmond” post on my blog, as I did not separate 98052 from 98053 in that “Redmond” post.

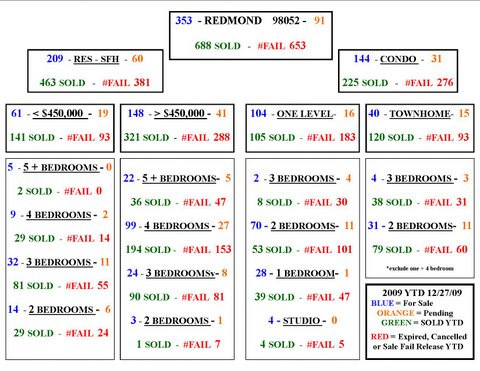
Let’s start with an overview of Redmond 98052:

98052 stats

I’m going to start with 3 bedroom townhomes. Only 4 on market, 3 Pending and 38 sales year to date. Looks like a pretty strong sellers market in that group until you get to the #31 #FAILed attempts. Let’s see if there is any Shadow Inventory in there, and if so, why.

My first thought was maybe they were early in the year, but no. 14 in the first half and 17 in the 2nd half.

Going through the #FAILS one by one is tedious. I’m going to show the results for the first seven properties and then summarize. Seeing a few of the “stories” will help you judge my accuracy, as it is a subjective process. I originally had all of them listed, but it made a long post beyond reasonably long.

#FAIL #1 = Shadow Inventory.- Looks like they decided to stay when they couldn’t get their price. Plenty of equity. No mortgage. Not going to come back as a distressed sale. It was $40,000 overpriced then $30,000 overpriced, then they quit.

#FAIL #2 and #3 = Shadow Inventory – Priced well when they took it off market for the holidays. Started out $100,000 overpriced which is A LOT in this price range. Over 30% over priced. On market for well over a year, but priced properly by they time they quit. Will likely come back after the holidays. Nice place. Could use a little staging help.

#FAIL #4, #5,, #6, #7, #8, #9 This one’s been failing repeatedly. 6 of the 31 #FAIL’s for 2009 are this one townhome. Went into escrow several times and fell apart on inspection several times even though it is a newer townhome. Just a train wreck. It may be shadow inventory forever, so I’m not counting it as shadow inventory. It should be rented.

#FAIL #10 = SOLD – No big story. Started out a little high. Relisted with a 5% reduction and it sold. A “normal” #FAIL.

#FAIL #11, 12, 13, 14 (Plus 5 in 2008) This is one of those agent’s that lists for 30 days so it expires and she picks up a new listing number. It’s a SOLD now for almost $100,000 less than when it started.

#15 Overpriced = Shadow Inventory Overpriced by about $50,000 for a year with no price change. The first agent quit after 30 days, likely because they wouldn’t do a price reduction. It will be back eventually.

#FAIL #16 It was a rented property when it was listed and looks like after a half hearted attempt to sell it, they continued to rent it. I wouldn’t call it a shadow inventory unless you want to call all rented property shadow inventory.

So, to answer Darin’s question, 20 Properties Failed 31 times. So let’s call 2/3rds of #FAILS = the number of properties involved.

To answer Does #FAIL = Shadow Inventory? Of the 20 properties remaining after step number one I would say it’s about half Shadow Inventory and 25% SOLD and 25% not coming back anytime soon.

I didn’t see any that were short sales or any that could become short sales or foreclosures. Most had plenty of equity.

Going back to the chart insert anyone interested in 98052 should print that out. Lots of detailed breakdown there of everything that happened in 2009. We’ll take the 653 #Fails less 1/3 for Repeat fails of same property = 435 less 25% SOLD = 325. Maybe 250 are Shadow Inventory and the rest will stay as rentals for some time.

REQUIRED DISCLOSURE: Stats in this post are not compiled, verified or posted by The Northwest Multiple Listing Service.

An Alternative Approach To Home Buying

Historically, a homebuyer first calculates how much home they can afford. They either do this on their own by calculating a % of their gross income, or they go to a lender who produces a home price “suitable” to their financial situation.

When you need a new coat, do you calculate how much coat you can afford? Sometimes, yes, if you are on a limited budget. But more often you simply buy one you like at a reasonable cost. Why isn’t home buying more like that? Probably because there is limited access to what “reasonable cost” is for a given area. Let’s take the time to study “reasonable cost” and also promote asking your agent this question: “Is the home I am buying a reasonable cost for this area, based on ALL homes recently SOLD here?” Remember, you are not asking for “3 comps”. You want to know how valid this price is for this particular area, generally speaking. In other words, you want to know if this is going to be a reasonable cost IF and when you have to sell the house you are buying.

When people are looking for a home to buy, they are mostly looking at homes for sale. They may look at homes that sold nearby “the comps”, but rarely do they look at a complete picture of what has sold vs. what is for sale.

Let’s look at how that may skew your perspective.
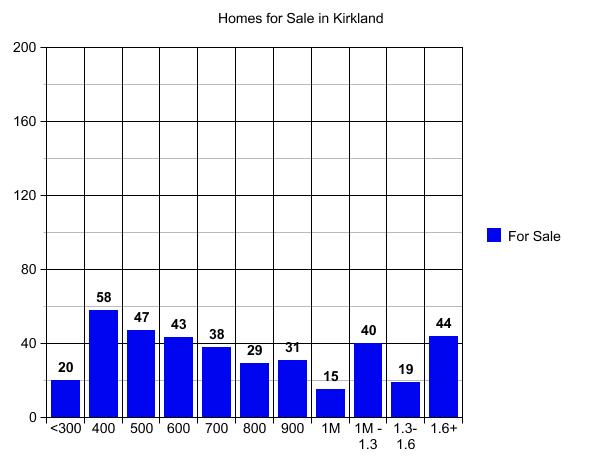
graph (14)

A quick study of price in Kirkland looking only at homes for sale at this time (graph above), would lead you to believe that the Housing Market in Kirkland is 60% or so under $800,000 and 40% or so over $800,000, with about 25% over a million dollars.

Now let’s layer in the number of homes SOLD in those price ranges in 2009 YTD (graph below). You will quickly see that 66% sold for under $600,000 vs. 60% under $800,000, and over a million is not 25%, it is more like 10% of the current “market”.
graph (15)

Now we get to the part my clients find MOST annoying about me. Let’s look at the home you are buying from the standpoint of you being the one trying to sell it. You cannot focus on a home’s weaknesses unless you can switch your mind from buyer to seller. Honestly, most of my buyer clients can’t do that no matter how hard they try, especially if they are first time buyers, and so I have to do it for them. But the visual below helps drive home the point that you may fail to sell this home you are buying today, even if you do all of the right things when it comes time to sell it.
graph (16)

There are many ways to use this information. First I’m going to ask you to look at the worst statistic in the graph above. I know most readers of this post are not in the $1.6 million plus price range. But look at this segment so that you can more easily “get” the point, and then apply it to your price range.

Green = Only 9 sales above $1.6 million

Blue = 44 people are currently trying to sell homes above $1.6 million

Red = There were 116 Failed Attempts to sell a house for over $1.6 million in 2009 YTD

IT TOOK 116 FAILED ATTEMPTS TO SELL 9 HOMES!

ONE HUNDRED AND SIXTEEN (116) FAILED ATTEMPTS IN ORDER TO GET NINE (9) N I N E homes to SOLD!

(Funny, I just checked that for the umpteenth time because it is so startling, and now there are 10 vs. 9. Still, same point.)

Sorry for yelling, but I wanted to make sure you got that point 🙂 What is a #FAIL? It’s a cancelled, expired or “Sale Fail Release”. That is not 116 properties. One of those 9 homes that sold could = 5 or more failed attempts to sell, before it actually sold.

Only the first two price segments, homes sold for $400,000 or less, had fewer failed attempts than homes sold. That’s roughly 1/3 of all homes being purchased in Kirkland. That means 2/3rds of all home buyers will likely have a difficult time selling. The degree of difficulty increases as the price increases.

You may ask “Do all agents look at the #FAIL stats?” The answer is “used to be”. Factoring in the “Failed to Sell” properties when doing a Comparative Market Analysis became a little “old school” during the hot market. Fewer properties failed to sell, and fine tuning a home valuation prior to making an offer was not standard modus operandi. I remember a new agent coming to me in 2005 asking “Where’s the button I push to tell me the home value?” I laughed; they did not. 🙂

I was trained to note “for sale” in blue, sold in “green” (real $) and Failed to Sell in Red as in STOP! But during the hot market there was no STOP sign and no brake peddle, for the most part. Newer agents were rarely if ever taught how to use the brake peddle, nor did one come with the training.

Let’s look at why that was.

In 2001 in Kirkland, 555 homes sold at $300,000 or less with 364 #Failed attempts.

In 2004 in Kirkland, 291 homes sold at $300,000 or less with only 50 #Failed attempts.

By 2006 in Kirkland only NINE (9) homes sold at $300,000 or less and only 1 #Failed attempt.

Who could train an agent how to value a property and how to consider the #Fail rate in a market like that? Why would you? So most agents who got their license in the last 5 years have a tendency to ignore the #Fail rate. Hopefully this post, in addition to assisting buyers and sellers of homes, will also suggest to a few agents that #Fail rate is immensely important to the home valuation

There is no button to push to tell you what to do with those #Fails. Valuing a home is returning to the “art form” that it once was, with subjective consideration of the #Fails. So back to the question: What is a “reasonable cost” for the area where you have chosen to buy? It’s a combination of the price paid by the majority of home buyers in that area AND the #FAIL rate for that price.

Take a look at Bellevue, for example. One of the biggest mistakes you can make in Bellevue is getting qualified at $1.5M and then trying to find the house closest to work that fits that price. You may end up with a McMansion on a busy road. A “McMansion” is not just a big house. A “McMansion” is a big house “worth” $1.5 million, stuck in the middle of an area where 90% of the homebuyers pay $500,000 give or take for a home. Perhaps taking that same house out of there and putting it in 98004 in the right location, transforms it into a home at “reasonable cost” for that area.

I’m using a somewhat ludicrous example to make a point, but buying an $800,000 home in an area where 92% of homebuyers paid $500,000 or less, can be equally “unreasonable”. Maybe not when you are buying it, but when it comes time for you to sell it.

Take a look at these graphs of Redmond. What seems to be the “reasonable cost” there? Different people will look at that same chart and answer it differently. About half the people paid $500,000 or less. If you only want a new house, you may work up the graph to only include homes built since 2003 or so. But do your homework. Work up a graph and don’t stop at “homes for sale” as shown in the first graph in this post.

An Alternative Approach To Home Buying may be deciding WHERE you would like to live, and then paying a “reasonable cost” for that area, even if that price is much less than you “can afford”.

When you need a new fleece hoodie, it really doesn’t matter that you can afford to pay $5,000 for it, does it? You’re still probably going to pay about $100 or less for it. If you look hard enough you can probably find a fleece hoodie for $5,000, or get someone to custom make it for you. But why would you?

Required Disclosure: Stats in this post are not compiled, verified or posted by The Northwest Multiple Listing Service.

It’s a Wrap…the New vs Old Good Faith Estimate

NOTE:  This is just my interpretation of the new GFE and I am only a mortgage originator and blogger. This post is just based on my opinion.   Please check with your compliance department at your mortgage company to learn about the GFE requirements.

This the last post in my series of four on comparing HUD’s new Good Faith Estimate to our existing GFE, which is retired on December 31, 2009.   I actually feel like I’m losing an old friend that I’ve relied on for years to help educate consumers.    HUD’s new GFE does not disclose the total monthly mortgage payment (PITI), seller closing costs credits or funds needed for closing.

This is a snapshot of the bottom portion of my current Good Faith Estimate which shows the total payment (upper left corner), closing costs summary and funds needed for closing.

Transactionsummary

HUD obviously feels this type of detail must be overwhelming to the average consumer.  But why total payment, seller closing costs credits and funds needed for closing are missing leaves me scratching my head.

Below is HUD’s summary of closing cost with the new Good Faith Estimate.

summarycharges

As compared to our “old” GFE (below) which clearly outlines the sales price, closing costs and prepaids, the seller credit of $7,500, credit to the buyer for their earnest money deposit of $1,500 and the financed upfront FHA mortgage insurance.   The buyer can also see the funds that are estimated to be due at closing on the purchase of their home.  

FundsNeeded

This is for the same transaction that I’ve been using throughout this series. 

Here is the closest thing you can find resembing a mortgage payment on the new GFE:

newpimi 

This figure above does not include property taxes or home owners insurance which will be included in the borrowers monthly mortgage payment.

Here’s a close up of the mortgage payment on my old GFE:

oldPITI

This actually shows the total mortgage payment and will factor in the monthly home owners association dues (even though it is not a part of the actual mortgage payment).

It’s a pity that PITI has been removed from the new GFE.

For more information about the new Good Faith Estimate, you can start reading HUD’s newly revised 49 page: Shopping for your Home Loan. The GFE review starts on page 11.

Hey home buyers and/or borrowers: which good faith estiamte do you preferred? HUD’s “new and improved” three page document with lump sum totals including closing costs you don’t pay for? Or the existing (for a few more days) GFE that resembles your estimated HUD that you’ll see at closing with details on the specfic closing costs, total monthly mortgage payment and funds due at closing?

New vs Old Good Faith Estimate Continued…

NOTE:  This is just my interpretation of the new GFE and I am only a mortgage originator and blogger. This post is just based on my opinion.   Please check with your compliance department at your mortgage company to learn about the GFE requirements.

Previously, I reviewed page 1 of the 3 page good faith estimate which will be required for all residential mortgages effective with applications as of January 1, 2010.   We’re moving on to page 2 of the new good faith estimate and comparing it to the old Good Faith Estimate that I (and many) have used.

The current good faith estimate, which is to be retired at the end of this year, provides a line itemization of closing costs.  
ECC

Section 800 of the dear old good faith estimate for the most part contains what the new good faith estimate is now on page 2 of the HUD’s Good Faith Estimate.

What used to be line itemed in Section 800 of the old GFE is now for the most part, lumped together under “Your Adjusted Originated Charges” less third party fees. When you look at the current (soon to be retired GFE); I’m basing this on lines 801, plus lines 811 – 814 even if the seller is paying the fees…by the way, there is no place on the new Good Faith Estimate that shows the seller credit…but if you don’t disclose the funds for closing, I guess HUD feels that point is moot!

Block one of the Good Faith Estimate cannot change–once a GFE is issued, unless it qualifies for a “changed circumstance” or the GFE “expires”, the Mortgage Originator is bound.   A “changed circumstance” is not as easy as it sounds…and warrants a post of it’s own.   They must be documented on only the fee impacted by the changed circumstance is allowed to be modified.  Mortgage originators should be prepared for banks/lenders to balk at your explanation of the changed circumstance–expect to have to “eat the cost” difference if the bank doesn’t “buy it”.

Quick reminder, this post is just to compare a specific FHA scenario based on a current and the new GFE–so if a LO has discount points or YSP, this would look different and it will take a follow up post to review it.

The next section on the new GFE is “Your Charges for All Other Settlement Services“.

YourChargesforAllOtherSettlementServices

Block 3 of this section are items the lender selects and that the borrower cannot. Since this scenario is an FHA loan, it includes the FHA upfront mortgage insurance. This section is subject to the 10% tolerance in aggregate “bucket”. On my old GFE, comparing estimate to estimate, these specific fees would be found on lines 803, 809 and 902.

Block 4 is for the lenders title insurance policy and the escrow fee/settlement services. They’re now lumped together. It doesn’t matter if it’s the same company or not. If the borrower selects a provider from the list provided by the lender, it’s subject to the 10% tolerance. If the borrower deviates from the list, there is no limit to how much the fees can adjust. If the lender does not provide a list, there is zero tolerance from the good faith estimate to the HUD-1 Settlement Statement. I suspect that some big banks will use this to try to capture title or escrow business. On my old GFE, these fees were shown on lines 1101 and 1108.

Block 5 is a doozie. HUD does a great job contradicting themselves with whether or not the owners title insurance policy fee needs to be disclcosed here. In Washington State, this is typically a fee charged to the seller. Yet it really appears as though HUD wants this cost disclosed to the buyer EVEN IF THEY’RE NOT PAYING IT. This fee is not on the old GFE.

Block 7 are the recording fees and is shown in section 1200 of my GFE. Even recording fees that the seller typically pays may be disclosed here. This is shown in section 1200 of my old GFE.

Block 8
is for “excise tax” and it’s my understanding that the only county in our area where the buyer actually pays a portion of excise tax is San Juan County. If I’m wrong–please correct me!

Old/existing Good Faith Estimate below shows the items the lender requires to be paid in advance (prorated interest, 1 years home owners insurance for a purchase and the upfront FHA mortgage insurance) and the left and what is required to start the reserve account.  NOTE:  this is my personal GFE (generated from Encompass).

Reserves_Prepaids

Block 9 discloses what is charged to start your escrow reserve account (line 1001 and 1004 on my old GFE).

Block 10 is the prorated interest based on the day the loan is closing (line 901 of my old GFE).

Block 11 is the estimated (in this case) annual home owners insurance premium which is disclosed on line 903 of my old GFE.

If you add the “adjusted origination charges”  (Box A)  to the “your charges for all other settlement services” (Box B), you come up with a “total estimated settlement charges” (which also includes the owners title insurance policy which is not paid for by the buyer in these parts).    Again, this does not factor in any seller credit–the only credit factored into the new GFE is in the form of YSP (yield spread premium).

summarycharges

I’m going to miss you, Old Good Faith Estimate!   The two things home buyers ask most from the lender (after what’s your rate) is “how much is my payment going to be” and “how much money do we need for the down payment and closing costs”.   HUD’s new GFE answers neither.

New vs Old Good Faith Estimate

NOTE:  This is just my interpretation of the new GFE and I am only a mortgage originator and blogger. This post is just based on my opinion.   Please check with your compliance department at your mortgage company to learn about the GFE requirements.

In a matter of days, all residential mortgage originators (we’re actually referred to as MLO’s now:  Mortgage Loan Originator) will have to adapt HUD’s new Good Faith Estimate…warts and all.   I promised Ardell that I would show her a comparison between the old and new GFE.   I won’t be covering everything line by line on HUD’s new page Good Faith Estimate–I’ve done that all ready…so some parts of this three page extravaganza may be missing from this post.

Page 1

Important Dates (click on image to for better viewing)

ImportantDates

This is a new feature to the good faith estimate.   GFE’s now have an expiration date if not acted upon by the borrower and certain costs are guaranteed for specific time periods.   Sounds great–EXCEPT I think you’ll find many MLO’s not willing to prepare a good faith estimate to the average “rate shopper” since HUD has spelled out that IF a good faith estimate is provided, it’s presumed that the mortgage originator has enough information to have a complete loan application.

In addition, line two states that MLO’s are held accountable for the third party closing costs they are using in their quote for 10 business days.   So if I rely on an escrow rate sheet from Tim’s company, and they happen to adjust upward during those 1o business days and the consumer decides to proceed with the rate quote, I could potentially be on the hook for the difference.   In reality, there is no way for a MLO to guarantee a third party fee unless they are willing to “eat the difference”.

Summary of your loan (click on image to for better viewing)

SummaryOfLoan2

This section gives you the basics of your loan.   For this estimate, I’m using an FHA loan and as I mentioned in my previous post, some of the details may be wrong.  For example, this references “initial loan amount”…as I write this post, I’m not 100% sure if this should be your base loan amount with an FHA loan or total loan amount (base plus the upfront mortgage insurance which may or may not be financed–perhaps that’s the fine detail: whether or not the borrower finances the FHA upfront mortgage insurance)…I’ve checked HUD’s FAQ’s (all 51 pages based on the latest update last month) and cannot see where this is addressed… anyhow… I went with base loan amount since other closing costs (such as origination fee) are factored off that figure.

Everything is pretty self explanitory…my issue with this section is the fourth line down:

“Your monthly mortgage amount owed for principal, interest, and any mortgage insurance is: $1648.31”  

This payment does not include taxes or insurance.  On the old/existing GFE, my clients actually see a total payment (PITI) of $2008.21.   PITI is gone on the new Good Faith Estimate…I don’t who’s bright idea at HUD this was…now we have PIMI:  principal + interest + mortgage insurance even though the borrower still makes the PITI payment.

Even the next section, escrow account  information, restates the “PIMI” where the GFE could have at least stated what the estimated escrow payment (real estate taxes insurance) would be so that consumers could add these two figures together to come to their actual mortgage payment…but no…that might make a bit of sense.

The bottom of page one refers to closing costs that are shown on page 2…which I will address on the next post.