After reading Dustin’s Blog Posts on a Map?, RedFin’s big coding contest, and the lack of “more interesting things” to blog about (Sorry, I can only whine about the MLS before I start repeating myself), I’ve decided to show folks how to create a simple Real Estate mash-up. I want to upgrade Zearch to the latest Virtual Earth technology (I’m still using version 2, but the current version is version 4) during the Christmas break, so I figured I might as well share the knowledge I’ll be gaining from that experience.
Mash-up 101: Virtual Earth
Prequisites: Basic Computer Literacy, HTML 101
Hello class, welcome to Mash-up 101. In today’s session we will learn how create web page that contains a Virtual Earth map control. It’s easier than you might think!
First you need to fire up your favorite text editor (Professionally, I usually use SlickEdit 11 or Visual Studio 2005, but I’ll use the world famous Notepad text editor for today’s class). Then and create an empty web page and save it to your desktop.
<html>
<head>
<title>Mash-up 101: Virtual Earth</title>
</head>
<body>
This is my first <b>Virtual Earth</b> mash-up.
</body>
</html>
|
HTML (which stands for hypertext markup language). HTML is the language used for creating web pages (it what you see, when you click View Source in your favorite web browser). All those funny <html>, <head>,<title>, <body>, and <b> things you typed in are HTML tags. When a web browser loads a web page, it reads the tags to determine how a web page should appear and behave. If the following is over your head, you should to take HTML 101 before you read any further.
OK, now that we have a simple page, we need to create our map control. First we need add a <div> tag that will be the container for our map when we are finished and we need to add a <script> tag which will download the map control’s code onto the page. Next we need to add an event handler to the <body> tag so the browser will call our code and create the <script> block that contains it.
<html>
<head>
<title>Mash-up 101: Virtual Earth</title>
<script src="http://dev.virtualearth.net/mapcontrol/v4/mapcontrol.js" ></script>
</head>
<body onload="loadmap()">
<script>
function loadmap()
{
alert("Are you ready for some mash-ups?");
}
</script>
<div id="VEMap" style="position: relative; border: solid 1px black; width: 600; height: 400"></div>
This is my first <b>Virtual Earth</b> mash-up.
</body>
</html>
|
Now, you have a boring page with an empty rectangle that pops up an alert! Big deal you say? Well, hang on sports fans, here comes the cool part. Pay attention now.
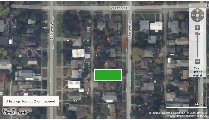
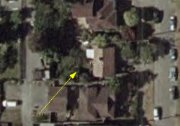
We now need to change our loapmap function so it will create a map of our choosing. The following Javascript code will create an aerial map around the Space Needle.
var vemap = new VEMap(‘VEMap’);
var vepoint = new VELatLong(47.62, -122.349);
vemap.LoadMap(vepoint, 17, ‘a’);
The first line of code creates a Virtual Earth map control. The second line of code defines a latitude & longitude (in this case, a couple yards south of the Space Needle). The last line of code tells the map control to create a map view that is an aerial map, a 100 yards or so above the Space Needle. Put it all together, and you’re code should look something like this…
<html>
<head>
<title>Mash-up 101: Virtual Earth</title>
<script src="http://dev.virtualearth.net/mapcontrol/v4/mapcontrol.js" ></script>
</head>
<body onload="loadmap()">
<script>
function loadmap()
{
var vemap = new VEMap('VEMap');
var vepoint = new VELatLong(47.62, -122.349);
vemap.LoadMap(vepoint, 17, 'a');
}
</script>
<div id="VEMap" style="position: relative; border: solid 1px black; width: 600; height: 400"></div>
This is my first <b>Virtual Earth</b> mash-up.
</body>
</html>
|
Word of warning, WordPress is a lousy HTML code editor. It changes and breaks things after you save them. (Or at least Dustin’s deployment of it on RCG does). Anyway, if you have trouble getting things to work make sure you replace all the forward, backward quotation marks with the standard quotation marks or apostrophies. Otherwise, goto http://www.annaluther.com/mashup.html to see what a working version of this example looks like.
Assuming there’s a demand for another class, future classes will cover the joys of pushpins, how to create a Google Maps mash-up or other more advanced topics.

 After last month’s
 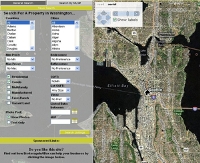 My biggest gripe with Redfin has been their use of space, most notably the size of their map. In my eyes you could get an idea of the neighborhood, but not a great idea without knowing the area already. Virtual Earth’s full size maps on the other hand were and are great. NWMLS made us change the name of the map because of the words MLS in the URL.