December 2010 King County SFH

There’s a big hoo-ha brewing over the December 2010 “increase” in home sales. Not to worry. It’s more of a “Lies, Damned Lies and Statistics” argument, than a true market change of any kind.
bottom chart

As you can see in the chart above, prices are still trailing along the bottom from the price in the red block of March 2009.

Volume for the 4th Quarter is higher than 2008 and lower than 2009. The December up is simply a correction for November down. That correction could simply be a matter of reportings vs actual closings OR it could simply be longer loan processing times throwing some November closings into December.

Don’t worry about the noise, but do worry that more home buyers seem to be overpaying for homes these days than they have been for a couple of years. There is no market trend that will cover up those kinds of mistakes.
********
Required Disclosure: The Stats in the above chart are compiled be ARDELL and are NOT compiled, verified or posted by The Northwest Multiple Listing Service.

Note: The primary variance in my numbers vs other reportings is that most count townhomes in Seattle but not elsewhere. I even that out by not counting townhomes at all.

Townhome Prices – Green Lake et al

Home Prices in 98103 – There’s hardly a person in the industry, or who is thinking about buying and/or selling property in King County, who isn’t asking the question: “Where are home prices right NOW?” There’s a lot of speculation about the impact of the end of the Tax Credit on home prices. But what we need are real facts in real time.

We also need to know if there are any indicators, be that a Zillow Zestimate or a Tax Assessed Value or other valuation tool, that will help the general public know within a reasonable degree of certainty if a home is “priced well”.

This will be a series of posts in an effort to answer that question. The stats will be for closed sales within the last 30 days, so the number of properties will differ by the volume of sales in each given category.

In the Chart Below we are looking at:

Sales closed within the last 30 days – currently recorded as such in the mls
Type of Property is “Townhome”.
Area is Zip Code 98103 Specific neighborhoods per the listings are Green Lake, Fremont, Phinney, Greenwood. (Note “Green Lake” is a loose term, as the townhomes shown as Green Lake are actually further north into Licton Springs/Northgate in this sampling)

Are properties selling for closer to the Zillow Zestimate? The current Tax Assessed Value OR the previous year tax assessed value? Maybe it’s the Redfin AVM price or eappraisal? If any are close enough to be considered “right”, they are noted in blue.

We will study all info available to the public and see if we can come to any conclusions regarding accuracy, as compared to what the home actually sold for, within the last 30 days.
98103 - townhomes

This is a modest sampling, and we will need to review many more statistics in different places geographically and different styles of property to form any real conclusions.

Surprises? I was surprised that the one Bank-Owned sale was not more of a screaming deal (notes as B/O in the right margin). From my persepective, I am not necessarily looking for who is “right” as much as I am looking for a source that buyers may have decided is most credible when making an offer. I will need to do at least a dozen of these posts to form any real conclusions on that.

(required disclosure: The stats in this post and in the graph are not published, verified or compiled by The Nortwest Multiple Listing Service.)

WA State Real Estate Agents are now Brokers.

On July 1, 2010, real estate salespeople in Washington State will become brokers.  It’s taken the Department of Licensing a total of seven years from initial research to the final implementation having started in 2003 on this project. The revisions passed the legislature in 2008 and the law is now in effect. There are many, many questions still to be answered during the rule-making process which makes the transition challenging but not impossible.  Here are some of the higlights:

  • There are now two levels of licensure for individuals: broker and managing broker.
  • The ‘salesperson’ category has been eliminated. The entry-level license for an individual is now “broker.”
  • A person with three years of experience as a broker will now be able to become a managing broker.
  • The 2010 license law requires the licensing of brokerage firms. A real estate firm is any business entity (including a corporation, partnership, or sole proprietorship) that conducts real estate activities.
  • All real estate services contracts are between the client and brokerage firm, instead of between the client and any individual licensee. A listing agreement is the property of the brokerage firm.
  • A designated broker is responsible for meeting all recordkeeping and trust fund requirements, plus he/she has supervisory responsibility over all the firm’s licensees.
  • All first-time broker license applicants must submit fingerprint identification.
  • Those renewing their licenses must also submit fingerprints and have their backgrounds checked every six years.
  • Educational requirements have been increased for first time broker licensees as well as managing brokers. Existing licensees must take a transition course to update them on the licensing law changes.
  • A broker with less than two years’ experience (remember, I’m talking about a new real estate agent, now referred to as a “broker) is subject to one additional responsibility: working under a heightened degree of supervision. He or she must conduct all brokerage activities under the direct supervision of a designated or managing broker, and submit all signed documents to the designated broker for her review, within five days of the signing, and submit evidence of their required education courses to the designated or managing broker.

There are more changes relating to recordkeeping, trust accounts, the role of firms, and property management. The complete law and its rules can be found here.

I highly recommend all real estate agents brokers and other interested stakeholders join the DOL’s listserve. DOL sends out a new set of Frequently Asked Questions each week and has been doing a great job of keeping us up to date during the transition.

The following links are from the Department of Licensing
Overview
Frequently Asked Questions

Rulemaking

During the Transition Course, I’ve been asking my students at the end of class if they believe the new law changes will help the industry, hurt, or make no difference.  The majority of students believe the changes will help the industry raise the bar.  The three biggest changes they are happy with are: 1) the increased level of supervision required of new licensees;  2) the mandatory fingerprint/background check; and, 3) the increased level of required prelicensing education for new agents brokers.

As a side-note, I’ve had more than a handful of students ask what kinds of conviction on the background check would dis-qualify them from keeping their real estate license.  For the answer to that question, follow this link and scroll down to the section on “fingerprinting.”

Can Seattle Home Prices Drop “Another” 22%?

Can Seattle Home Prices Drop Another 22% was a question raised by many here in the Seattle Area, after Zero Hedge posted the Goldman Sachs forecast for Major Cities showing Seattle at a 22% drop by year end 2012. After calling for modest to almost no declines in several major cities, Goldman predicted a 22% drop for Seattle with the 2nd highest drop being only 12% in Portland, and even a 7% gain for Cleveland Ohio and a 5% gain for San Diego. That would put Seattle at minus 27% compared to San Diego for the same period.

You can pick up Goldman’s rationale or lack thereof in that first link, we’ll stick to how likely it is that Seattle could drop “another” 22%. First let’s take a look at where a drop of that size would takes us, in the graph below.
graph (1)
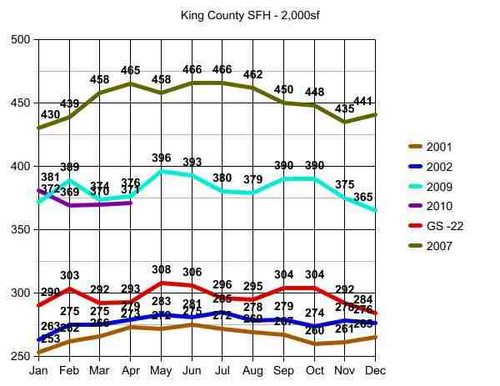
Important to note that I made a slight modification of the raw data for the graph above to account for modest home size variances, equalizing the data as to size of home or price per square foot. The closest rounding point was a median sized home of 2,000 sf. The data is in thousands, so top left in January of 2007 would be $430,000 median home price for a 2,000 sf home and bottom left would be $253,000 for a 2,000 sf home in January of 2001.

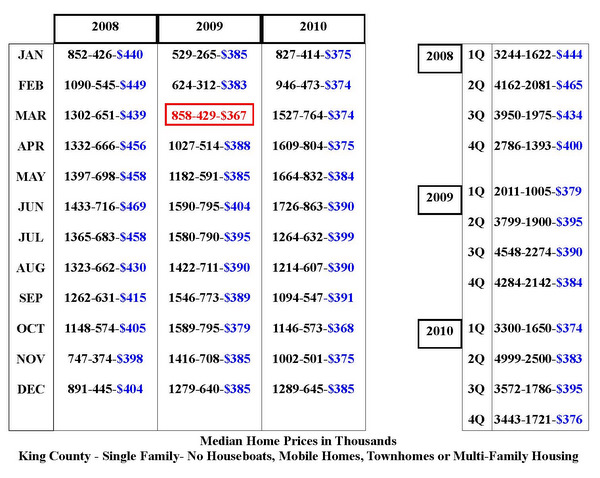
I posted a full chart of all of the raw data for those who want to create their own charts and modifications showing actual median home prices for the years in the graph above, median square footage of homes sold in each 30 day period and the # of homes sold. This is for Single Family Homes vs. Condos and King County vs. Seattle Proper.

Back to the graph above in this post. The top line is Seattle Area Peak in 2007. The turquoise and purple lines are “where we are” in 2009 and 2010 without significant difference except for seasonal variances in that 18 month period. I ended these graphs and the data at April 30 2010 due to the switch out of mls systems locally, but am seeing reports that May came in above April at $379,000. So the raw data suggests there is the normal seasonal bump up in May, as additionally influenced by the final tax credit closings which will continue until after June closings, and possibly slightly beyond.

The red line is the hypothetical Goldman Sachs prediction scaled against 2009 data at 22% below in each consecutive month.

********

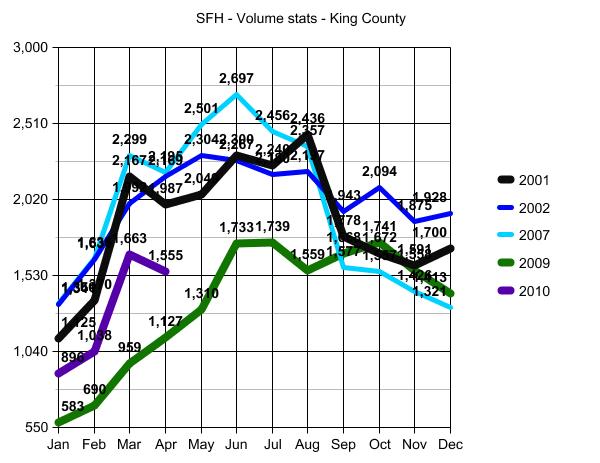
Before moving to conclusions, we need to visit the volume stats (graph below). I have been tracking volume for years in addition to price per square foot, as volume signals recovery or not more so than home prices alone.

graph (2)

Analysis is dependent on rationale of which data to apply, and for my purposes I have been using 2001 and 2002 as “Base Points” for two reasons:

1) 2001 is the earliest I will go when tracking home price and volume data, as Credit Scoring as the primary focus of lending pre-approval guidelines and risk-based pricing, was not a factor in the 90’s. Keeping apples to apples as to the number of people who can qualify to purchase a home, 2001 is a good start point.

2) 2003…toward the end of 2003…was the beginning of ZERO down/sub-prime lending standards. So all years from 2003 through mid 2007 will include an extra bump up as to volume and price created by that loosest of lending standards.

For both of the reasons noted above, it has been my long standing premise that volume of homes sold should be and can be expected to return to 2001 and 2002 levels as to number of homes sold.

One caveat: The number of condos built between 2001 and present is beyond proportional. Those additional “residences” in the form of condos and lofts in the Seattle Area will rob volume from the single family stats in some, and many, areas.

Note: In the second graph above, the volume of homes sold in October of 2009 (green line) exceeded the number of homes sold in October of 2001 (black line). This may not seem like something to view as a positive sign. But given the tremendous drop in volume as noted in January and February of 2009 to unprecedentedly low levels, surpassing 2001 volume stats by October of that same year was HUGE. Of course these numbers at both ends are influenced by the short breaks in the tax credit for home buyers in both January of 2009 and October of 2009…but still a significant signal reflecting that volume has the opportunity to recover to 2001 levels. NOT to 2007 levels! Volume cannot and will not recover to 2007, nor do I expect prices to do so until 2018 at the earliest.

Those who are waiting for a return to 2007 as to price and/or volume would likely have better luck betting on your favorite horse.

********
So, just how low will Seattle Area Home Prices go? Well first off let’s acknowledge that Seattle Area Home Prices WILL go DOWN. That seems obvious to me from the RAW DATA, but amazingly I still see many people questioning whether or not the market will go down at all from here. Hard to believe, but yes, some think the current level of $379,000 median home price is going to go up and not “EVER” down from there. One would think the credo of “home prices will never go down” was dismissed along with The Easter Bunny…but no. Some are still looking for a V-Shaped or U-Shaped “Recovery”. Sad but true.

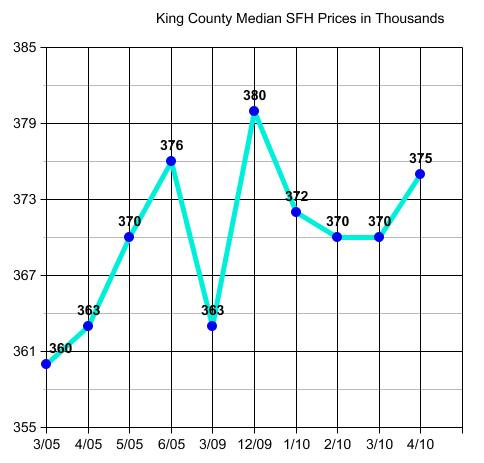
A- Home prices will most assuredly drop by 4.3% in the very near future and likely by 4th Quarter 2010. (See blue square in the RAW DATA link above.) That is where home prices were in March of 2009 before the tax credit was renewed. So seems obvious without the credit, that is where prices will go back to…and likely lower than that without a new tax credit to prop up prices from that point forward.

B- The Tax Credit was meant to stop the downward spiral and eradicate the portion of loss created by momentum and NOT the portion of downward spiral created by fundamental economic problems. It was to eliminate the Fear Factor and the over-correction. Not the market’s legitimate decline point. Consequently the “safety net” being removed is going to create an additional drop of at least 5% in addition to the 4.3% drop noted above, which would take us to a drop of 9.3%.

C- Goldman Sachs is incorrect in its analysis of a 22% drop, because they do not apply the above A and B factors to all Major Cities. So their basic rationale is not credible, nor the number that emanated from that incorrect rationale.

D- Near the end of the time frame for the tax credit, home buyers were not as likely to enter into contracts with short sales and to some extent even bank-owned properties, for fear they would not close on time. Consequently, the median home prices were overly weighted to the high end of my bottom call. The mix of property from here through year end is going to push more toward the 37% under peak of that same bottom call vs the 20% side of the equation, with more “distressed” property in the mix. Not because of increased foreclosures, but because of more people being willing to buy them without a drop-dead-must-close date via the tax credit. It’s really just common sense, and pretty much a given.

Look for a 9.3% drop at some given point between now and the end of 2011. That would be any month in that period with a median home price of $343,753 or thereabouts.

As to 2012??? I expect a significant impact on price, with further declines, stemming from continued layoffs between now and the end of 2012 on a fairly large scale. But this last prediction borders on “the crystal ball method”. So let’s end with a 9.3% drop from $379,000 median King County home price by year end 2011, with an added caution that significant improvement to 2007 price levels will not likely happen before 2018.

In other words…”EXPECT the worst; HOPE for better than that.”

(required disclosure – Market Observations and all stats in this post and the graphs herein are the opinion and “work” of ARDELL DellaLoggia and not Compiled, Verified or Posted by The Northwest Multiple Listing Service.

Is that home over-priced?

When my clients send me a home they want to see and ask for my thoughts, I often respond “nice house; seems a little over-priced to me”. Sometimes they wonder how I know that before seeing the house.

Using general statistics to establish an immediate reaction to price, gives you a good starting point for home valuation.
graph (41)

The above graph is a good “cheat-sheet” for shoot from the hip value reaction. We can see that the recent history bottom of 3/09 is equivalent to 4/05 pricing.

One of my clients sent me a property, nice one, and I quickly checked to see that the owner bought it brand new in the summer of 2004 for $600,000 and the asking price is $750,000. “Looks a bit over-priced” because it was brand new when they bought it, so they didn’t (or shouldn’t have needed to) remodel anything. We are at May/June 2005 pricing (as you can see in the above chart).

The market didn’t increase by 20% from Summer of 2004 to Spring of 2005. New homes depreciate as 2004 new carpet is now 2010 old carpet. 2004 new paint and hot water tank are now heading toward the down-slope of their life expectancy period.

By all accounts asking 20% more for a home bought new in 2004 is not likely realistic. Median home price in June of 2004 was $340,000. Current month to date median price is $375,000. so that would put that property bought for $600,000 in June of 2004 at $660,000 to $665,000 today before applying depreciation. ($375 divided by $340 times $600 = $660) So my gut reaction to a $750,000 asking price is that it is almost $100,000 over where it should be.

That doesn’t mean that someone won’t pay $750,000 for it. The only question is…Is that someone who will pay about $90,000 too much for it…YOU?

(Required Disclosure: Stats in this post are not compiled, posted or verified by The Northwest Mulitple Listing Service.)

When will housing prices recover? A national look.

Crystal Ball with HouseThis post is partly a follow on to Ardell’s earlier New Bottom Call post and comments on where our greater Seattle / Bellevue area home prices might go over the next few years.

 
When people ask me “How soon are home prices around here going to recover?”, I have been saying that I don’t think they will ‘recover’ for at least 3 to 4 years.

The question usually comes from someone who wants to sell, but is having a hard time dealing with the fact that the value of their home is down about 20% from the peak in summer 2007 – especially if that is when they bought it. Of course if they had bought it in early 2002, the value would have run up about 85% before it peaked, but it is truly much harder to take a loss than it is to take a gain 🙂

The next most common person asking the question is a buyer who is trying to decide if he or she is going to make money or lose money on their investment in a home. Recent history would certainly give one cause to pause on that question.

Of course there have been all kinds of predictions about which way the housing market is headed, and many of those predictions are colored by what is going on in the writer’s home market. But recently a friend sent me a very interesting analytical presentation of what is going on in the market, which included a map graphic showing what that analyst thought would happen. The chart was prepared by Moody’s Analytics, a big player who has a huge interest in figuring out what is most likely to happen, so I thought it was worth sharing with you. Here’s the chart, which is page 13 from the presentation linked at the end of this post.

Map2

This is a pretty fascinating chart. Note that some areas near us are predicted to recover to their previous highs within the next 2 to 3 years. And for some of the hardest hit areas, full price recovery may take 20 years.  Factor some inflation against that and I’m not sure it is a recovery.

In our own Greater Seattle / Bellevue area, it looks like their prediction is recovery to 2007 price levels in the 4 to 5 year timeframe at best. Still, all in all it doesn’t sound too shabby – that would be about 5% a year from here, or more like 3%/yr if it stretched out to the long side. My guess is that this recovery rate would be back-end loaded – lower (near zero) appreciation rates near term, and higher rates later on as the national economy really gets rolling again. We’ve got a lot of unemplyment to work off before that happens.

The whole presentation is linked here in the 2010 – Housing Recuperates presentation from Moody’s Fall 2009 Economic Outlook Conference. In the chart on mortgage default rates on page 10, the left axis is CLTV – Current Loan to Value Ratio; the chart is a little hard to understand unless you have that information set in your decoder ring.

Don’t get too hung up on month-to-month fluctuations in reported median prices.  As Ardell’s chart clearly shows, even with a county wide mass of data, the reported median can jiggle up or down a few percent.  Our median for the 16 months shown is about $380,000 +/-5%, or swinging about $20,000 on either side in any given month.  In January we had a nice 5% blip up in the condominium median price, but for February it was right back down where it had been most of the time for the past year.

Should you sell your home?

houseFive to one, more people are asking me if they should sell their home vs. if they should buy one. That said, I have more buyer clients than seller clients. Those buyers are simply not asking IF they SHOULD buy. The most difficult scenarios are those who need to do both at the same time, who cannot buy unless they sell, and who don’t want to put their home on the market until they know where they will go if and when it sells.

I ask three questions when someone calls or emails me asking if they should sell (now).

1) Why are you thinking about selling it?

2) When did you buy it?

3) Have you “cash out” refinanced it since you bought it, and if so, when?

When you read articles like this one, and see that Seattle Area home prices are at April 2005 levels (I agree) and peaked in May of 2007 generally (I say July 2007, but close enough), it should tell you that if you purchased during that timeframe, and even between April 2005 and present, it is highly unlikley that you will be able to sell it without bringing money to closing.

Funny…no one talks much about “bringing money to closing” these days, though it happens probably at least as often as a “short sale”. Everyone assumes “upside down” homes are “short sales”, when in fact many sellers simply walk into closing with a check the same way that buyers do. Even people who are qualified to do a “short sale”, often have to bring money to closing. Just because the home sold for less than was owed, does not automatically mean that the difference was waived permanently or temporarily. Sometimes the owner pays it in full, and sometimes the owner pays it in part.

Let’s take a somewhat ludicrous example to make that point. Say the net proceeds of the sale is $500 short from covering all expenses. Likely that $500 is going to be paid by someone, and not worth going through the “short sale” process. Another example: If someone is making their payments, has $100,000 in the bank and makes $120,000 a year and is “short” $20,000, not as likely that the lienholders are going to approve a short sale. That “seller” should be bringing $20,000 to closing. This is VERY important for agents to understand as many are listing homes as short sales simply because the amount owed is in excess of current fair market value. That is NOT the only criteria to “selling short” without bringing the needed difference to closing. If the owner can choose to stay in the home if they are not approved for a short sale, if they have the means to stay and plan to stay if they are not approved, that home should really not be on the market.

Given the knowledge we have that current prices are at April 2005 levels, give or take, let’s apply that to a specific example:

Should you sell your home if you bought it in January of 2004, and are relocating with your family to another State? Let’s say it is a 2,400 sf home in Redmond in X neighborhood, for example. I see several sales in the tax records of 2,400 sf homes in that neighborhood in the 1st quarter of 2005, all selling at approximately $530,000 which is about $100,000 more than they sold for in early 2004. Cost of sale is about 8%, so let’s call expected net proceeds after sale and possible repairs at inspection at about $90,000. Always best to round down to worst case scenario. Let’s call it $75,000, because you don’t want to put your house on market with the highest of expectations. Great if you get them, but not great if you have a vacant house on market for 6 months because you “want” $90,000 net proceeds.

If you would sell it if you could walk away with $75,000 plus your down payment back, then yes you should probably sell it. One reason you might want to rent it is if you want to “leave the door open” to possibly coming back if you don’t like your new job in that new State.

If you refinanced that same house in 2007 for $650,000, then you likely want to rent it for some period if you can, so you can take the loss as a write off by turning it into a rental property vs. a primary residence before you sell it. Check with your tax accountant before putting it on market for sale.

I can’t go through a lot of examples here in the blog post, but know that:

Why are you selling it?
When did you buy it”
Did you do a cash out refinance after you bought it?

are the three most important questions to be answered, that the person who is advising you needs to know before answering the question.

If an agent says “YES! You should sell it!” without asking these questions before answering, that probably means they just want a listing so they can get buyer calls from the sign and advertising, and use your home as “inventory” to get buyer clients. 🙂

Seattle Schools – Admit by Address

The Seattle Times reports that Seattle is returning to a neighborhood-based system. Given it has been about 30 years since Seattle abandoned that system, this is big news for everyone who lives in Seattle, particularly people who are buying homes in Seattle.

According to the article, this decision passed by unanimous vote last night at 11 p.m.

If we’re going to use our limited resources efficiently, this is a big opportunity to reduce transportation costs, balance out enrollment so that hopefully the vast majority of our schools have enough students in them to be successful,” said board president Michael DeBell.

When people are looking for homes to buy, having a geographically based school system is very important. Not knowing which school your child is likely to attend adds a layer of uncertainty to an already uncertain process. I’m sure this decision will be controversial, but I have to agree that when an entire community is vested in the success of the “neighborhood” school…the system will improve via more outside support. Also, it will be easier to target the schools and communities that need more support than the local community can itself provide.

I went to the school around the corner from my house. I could even see inside the school from my yard. My children always attended the school nearest my home, and I used “which school?” as the basis for my home buying decision. Parents and children from the neighborhood around the school volunteered to help with seasonal maintenance projects and had a vested interest in the school being a safe and attractive neighborhood component.

On all counts, I think this is a good decision. Still I expect it will have as many unhappy constituents as it has happy supporters, until the system is in place long enough for people to forget the three decade old “used to be”.

Zillow and the SeattlePI Partner-up for Property Searches

Zillow and SeattlePI business partnership

As is being widely announced in the news this morning, Zillow.com and the SeattlePI.com websites have partnered to offer co-branded website property searches. Ironically as of 8am you can find this story on Reuters, Inman News, and of course Twitter and Facebook. But Ironically it is still missing from the Homepage of SeattlePI.com.

The website will also offer Zillow’s other features such as home values, “just sold” data, local market data, etc.  As well as their custom real estate community content via Zillow Advice and mortgage rates from their Mortgage Marketplace function.

This raises some interesting issues for other companies, organizations, brokerages, and agents who  have property search functionality built into their blogs and websites in order to drive traffic to their sites, and ultimately derive business from it. Rain City Guide is a great example of a website that has recently added property search functionality through M Realty in hopes of garnering more viewers, and potentially a revenue stream as well. Many agents, including myself, have spent years developing websites that we use to attract potential buyers and sellers. Is Zillow now officially our competition?

Strategically this makes a lot of sense for both companies as the SeattlePI is struggling to re-create it’s business model after shutting down it’s printed newspaper version in March. And Zillow has recently been monetizing their searches through selling advertising to agent’s by zip codes.

I wonder what RCG’s readers and contributers think of this turn of events. It’s definately a “game changer”. The question is, what’s the new game going be like, and who’s going to get to play?

Are We Facing A Housing Shortage?

In looking at the latest Northwest MLS statistics for King County, it would be tempting to say that our housing market is recovering.  But it is an odd mix of data.  Single family home sales volumes are up (even better than last year), inventory is down sharply from last year, prices seem to be starting to rise again, and average days-on-market is dropping.  That all sounds pretty good.  (larger residential stats charts)

Residential stats 750

(Note that the Northwest Multiple Listing Service neither prepares nor is responsible for these charts – the interpretation is my own.) 

But condominium sales are still slow (though rising some), inventory is staying high, and median prices are not rising.  That doesn’t sound quite as good.  (larger condo stats chart)

Condominium stats 750

What are we to make of this seemingly conflicting data?

 What it looks like to me is that we are in the early stages of a housing shortage.  While Seattle and the west side have been built out for decades, Bellevue and the east side communities have been absorbing most of the region’s growth for the past 50 years or so.  But we passed the Growth Management Act in 1990, and then we added the Critical Areas Ordinances.  As a result, it has become harder and harder to get permits for housing developments of any significant size.  In fact it appears that over the last 10 years or so it has become far easier to get a permit for a 100-unit condominium high-rise than for a 100-home residential development.  The rate of application for new building permits “fell off a cliff